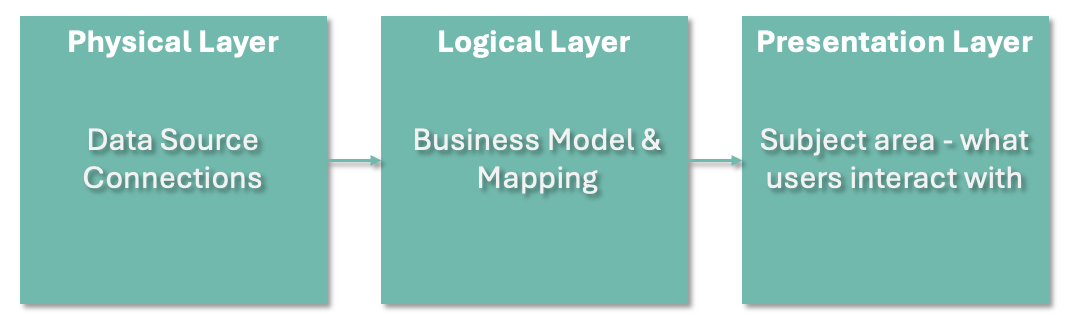
In Oracle Analytics Semantic Modeler, the Presentation Layer serves as the final stage in the data modeling process — it is the interface that end users engage with when creating analyses and dashboards.
This layer offers a business-friendly view of your data model by organizing and simplifying logical objects such as tables, columns, and hierarchies. It also allows you to control the visibility, naming, and grouping of elements within subject areas, making the data more accessible and intuitive for users.
Components of the Presentation Layer
-
Subject Areas
- A subject area is a collection of related tables and measures — for example, “Sales,” “Finance,” or “Inventory.”
- Each subject area typically corresponds to a single Business Model from the logical layer.
-
Presentation Tables
- These represent business entities such as “Customer,” “Product,” or “Revenue Metrics.”
- Presentation tables can be renamed to more user-friendly labels compared to their logical counterparts.
-
Presentation Columns
- Derived from logical columns in the Business Model and Mapping (BMM) layer.
- Columns can be renamed, reordered, or hidden to suit business needs.
-
Hierarchies and Folders
- Hierarchies (e.g., time or geography) enable drill-down functionality.
- Columns can be organized into folders or nested groups to enhance clarity and navigation.
-
Column and Table Permissions
- Permissions control which users or roles can view or interact with specific elements.
- This is essential for ensuring data security and tailoring the user experience for different audiences.
Common Tasks in the Presentation Layer
- Renaming tables and columns to reflect business terminology.
- Hiding technical or irrelevant columns from end users.
- Organizing columns into folders like “Sales Metrics” or “Customer Details.”
- Controlling display order, tooltips, and descriptions.
- Applying formatting to columns (e.g., date or currency formats).
- Enabling drill-down paths through defined hierarchies.
Creating a New Subject Area
Access the Presentation Layer via the fourth tab in the main Semantic Modeler navigation. When you create a new model from scratch, this layer initially appears empty.
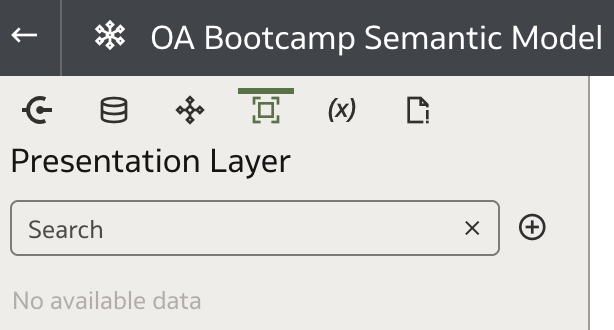
All content in the Presentation Layer is organized into Subject Areas.
A Subject Area acts as the top-level container within the Presentation Layer. It represents a logical grouping of data that users interact with when building dashboards, reports, or ad-hoc queries. Think of it as the user-facing lens through which your data model is viewed.
A best practice is to create one Business Model in the logical layer and map multiple Subject Areas to it. This approach allows users to pull data from different business domains and combine it in a single report — provided that shared dimensions exist across the subject areas.
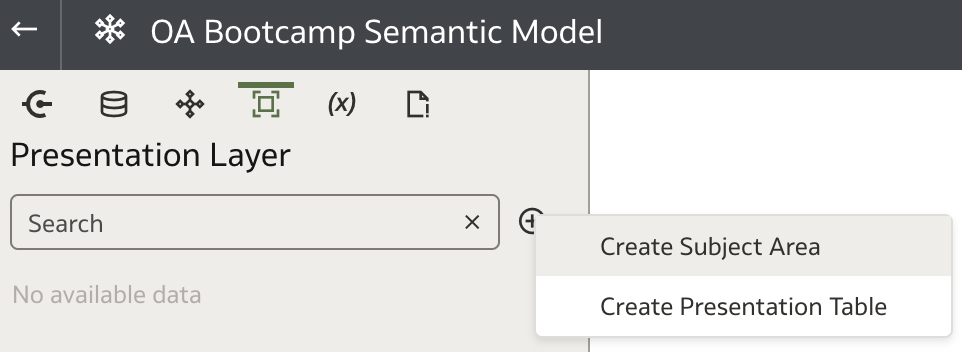
To create a new Subject Area, click the plus icon next to the Search bar and select Create Subject Area from the dropdown menu.
In the Create Subject Area dialog, enter a meaningful name for your new subject area.
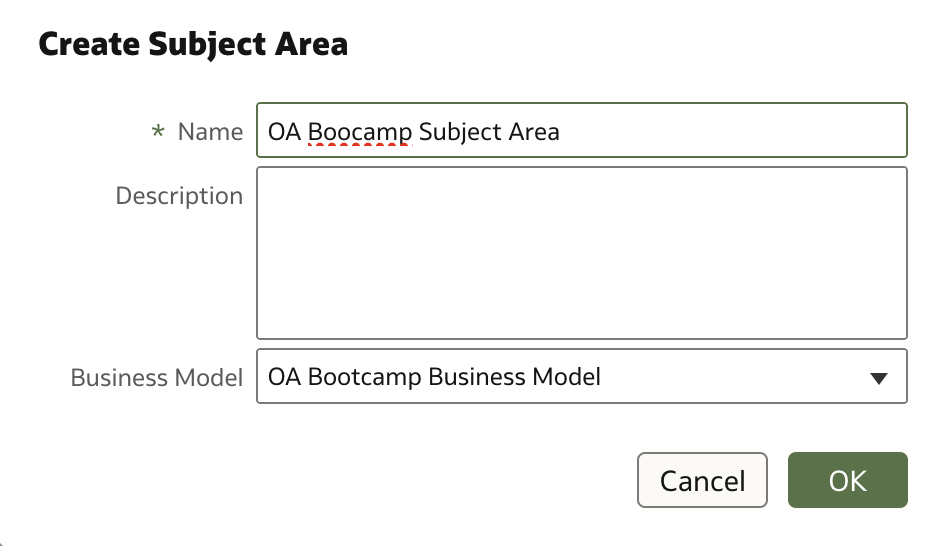
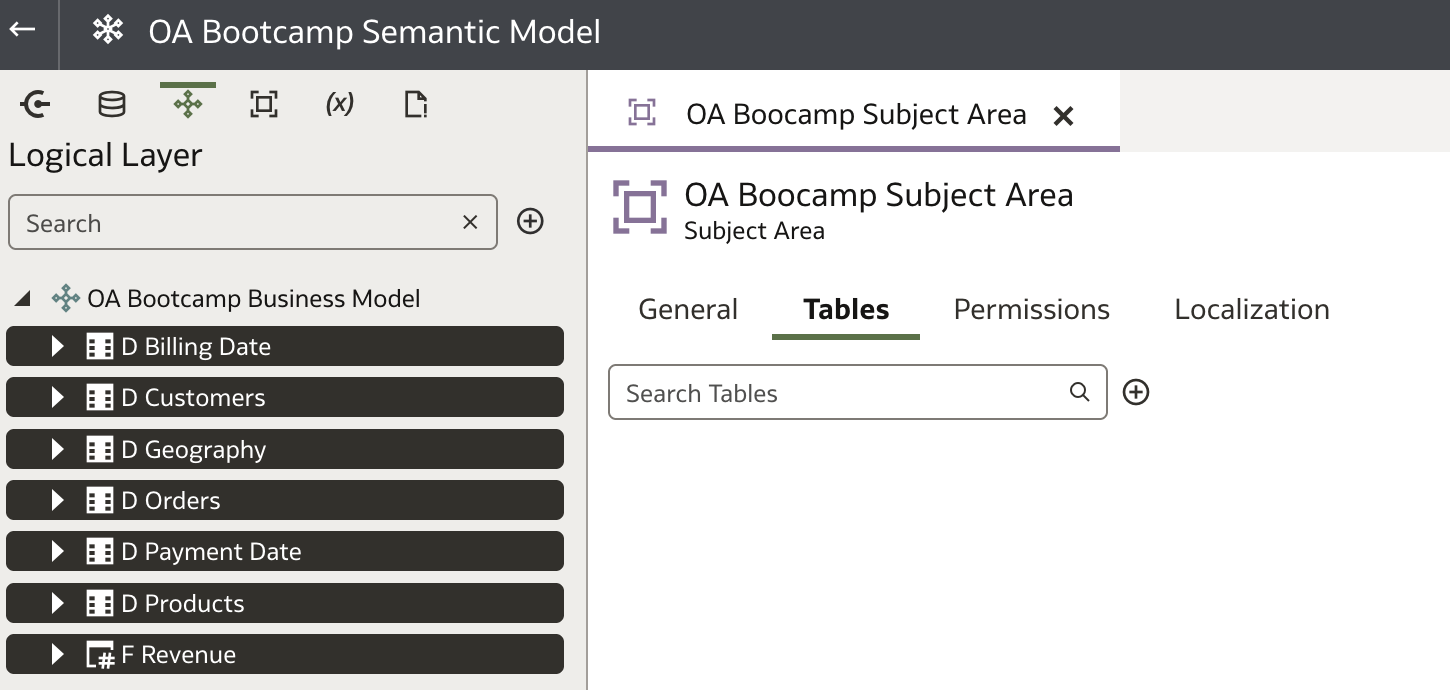
Once created, the Subject Area page opens, featuring several definition tabs:
- General: Define the name, description, and link the subject area to its associated business model.
- Tables: Add and manage presentation tables and columns, including hierarchies and folders.
- Permissions: Set visibility rules for different user roles or groups.
- Localisation: Provide multilingual labels and descriptions for internationalized deployments.
Adding Tables to a Subject Area
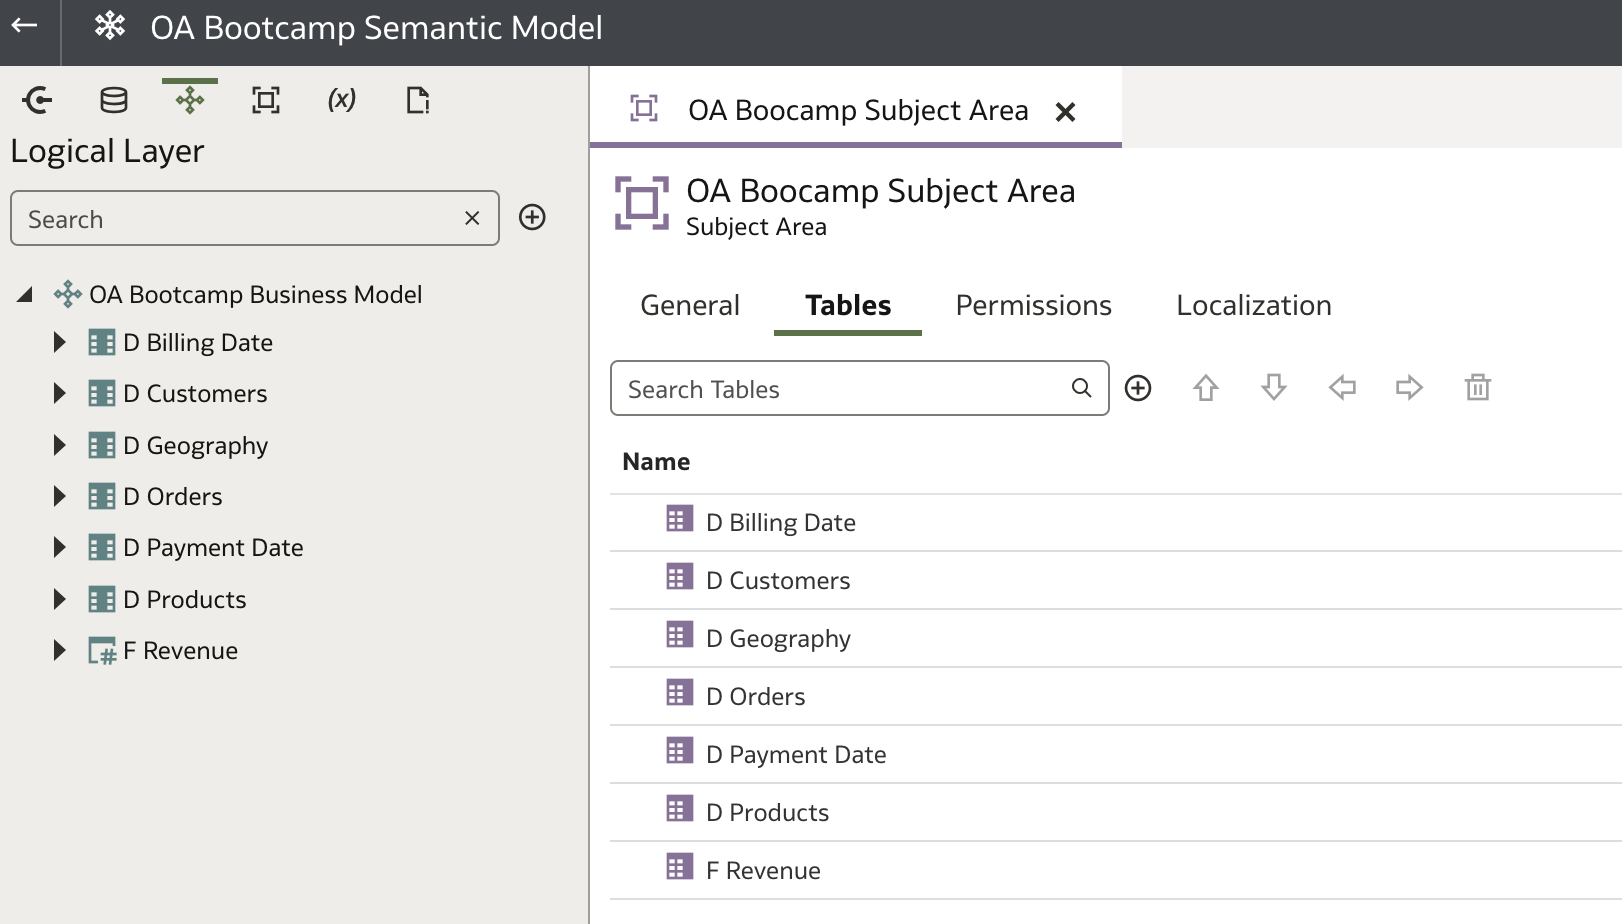
Within the Tables tab of the Subject Area, your task is to bring in tables and columns from the logical model. There are multiple methods to do this, but since our logical model already includes meaningful names and structure, we’ll use a shortcut.
Switch to the Logical Layer tab in the main navigation and expand the existing business model to display all tables. Select the tables you want to import.
With the Subject Area open in the Tables tab, drag the selected tables from the Logical Layer pane and drop them onto the Tables canvas.
After adding the tables, you can reorganize their order for a cleaner and more intuitive view:
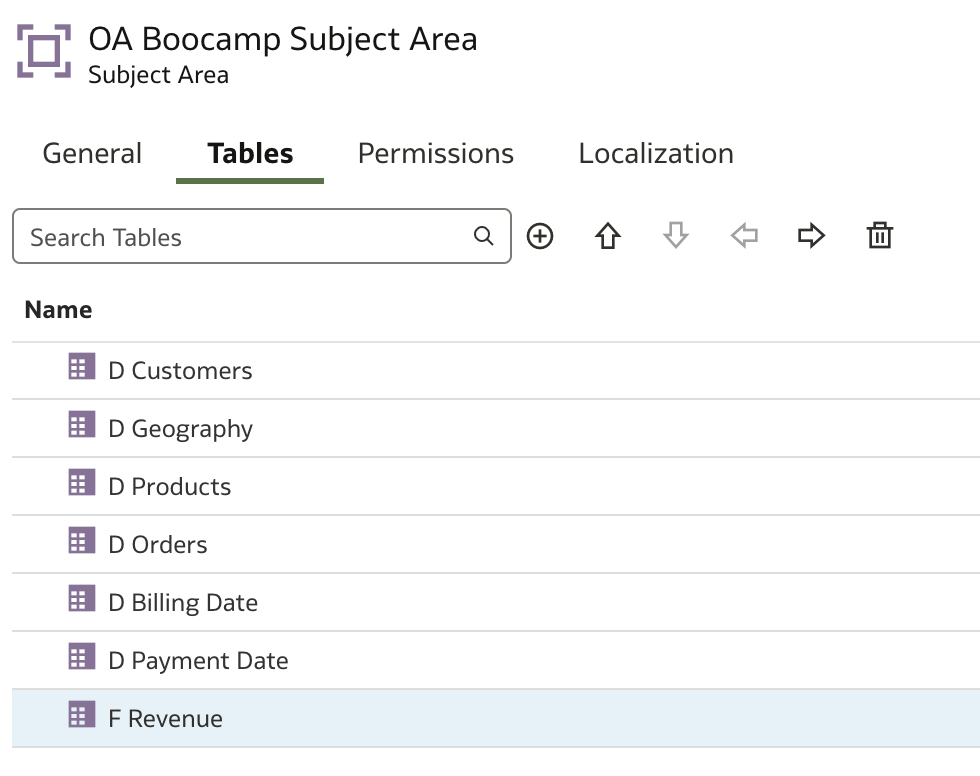
To customize further, double-click any presentation table name to open the Presentation Table page, where you can access the following options:
- General
- Columns: Rename columns or replace the associated logical column.
- Hierarchies: Create or edit drill hierarchies.
- Permissions: Set access control at the column level.
- Localisations: Add translations or locale-specific labels.
- Data Filters: Apply filters to restrict data exposure at the presentation level.
With these configurations complete, you are ready to move on to the final step: deploying the model.
Deploying the Semantic Model
Before deploying, it is crucial to validate your model by running a Consistency Check.
The Consistency Check verifies that the semantic model is logically sound, fully defined, and free of errors before publication.
You should run a Consistency Check:
- After making changes to logical models, joins, hierarchies, or subject areas.
- Before deploying the model to production.
- When troubleshooting query or report issues.
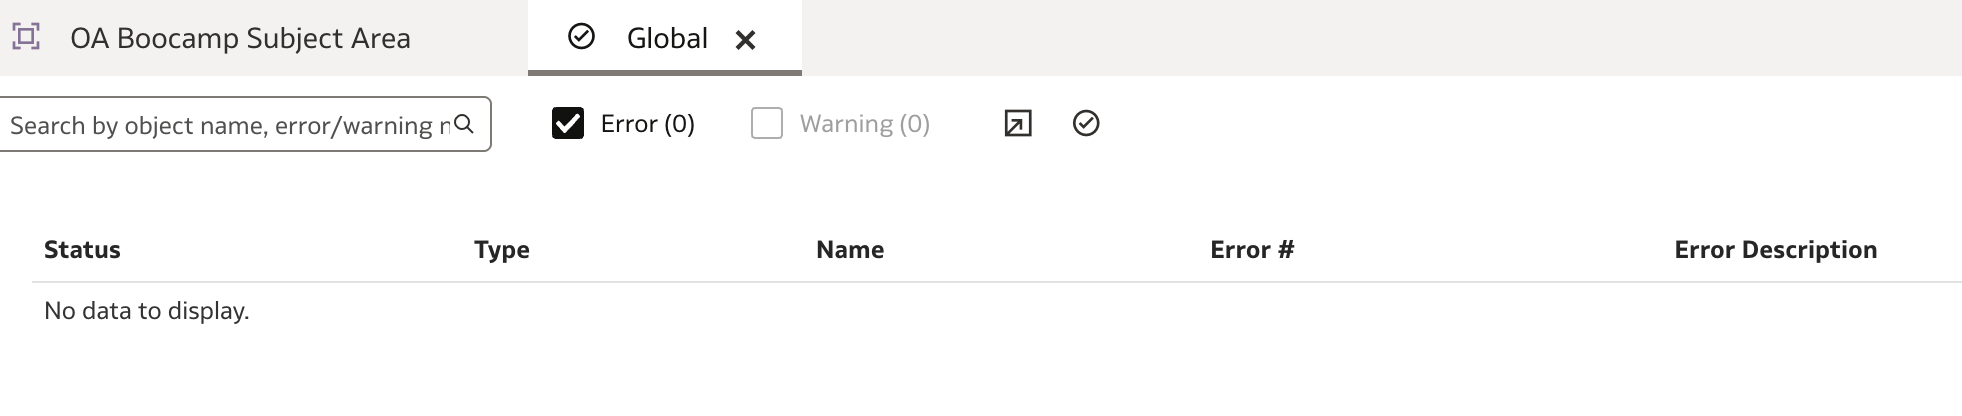
Click the Consistency Check icon in the top toolbar:

If no errors are found (warnings may still appear), a summary report will be displayed:
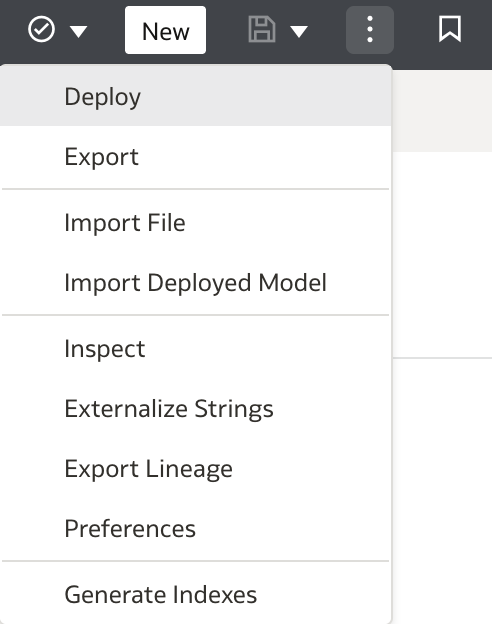
Once validation is successful, deploy the model by clicking the page menu (three-dot icon in the top right) and selecting Deploy.
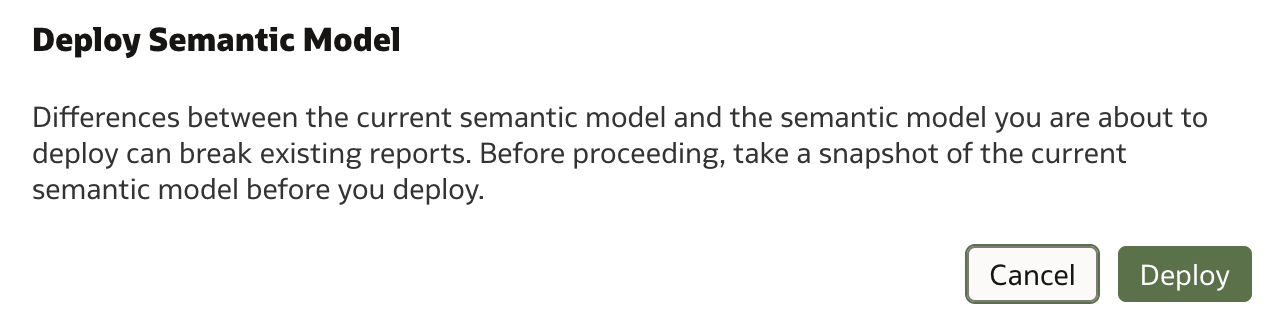
In the Deploy Semantic Model dialog, click Deploy to finalize the process.
A confirmation message will appear in the bottom-right corner upon successful deployment:

Testing the Model in Oracle Analytics
With the model deployed, you can now test it in Oracle Analytics.
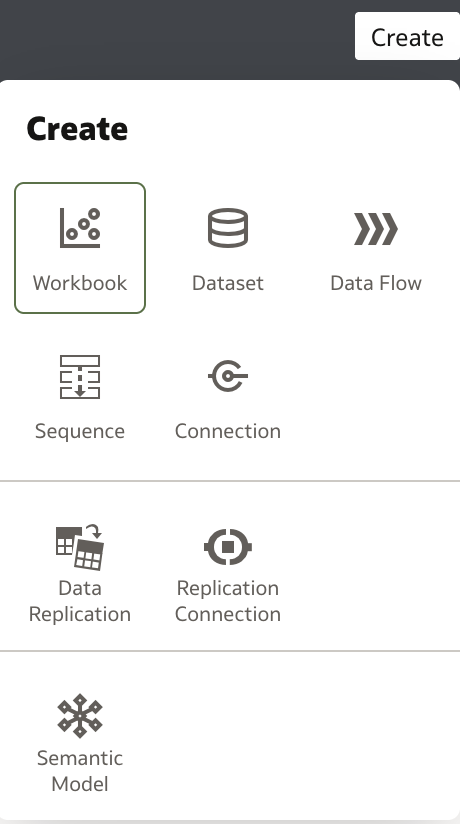
Begin by creating a new Data Visualization Workbook:
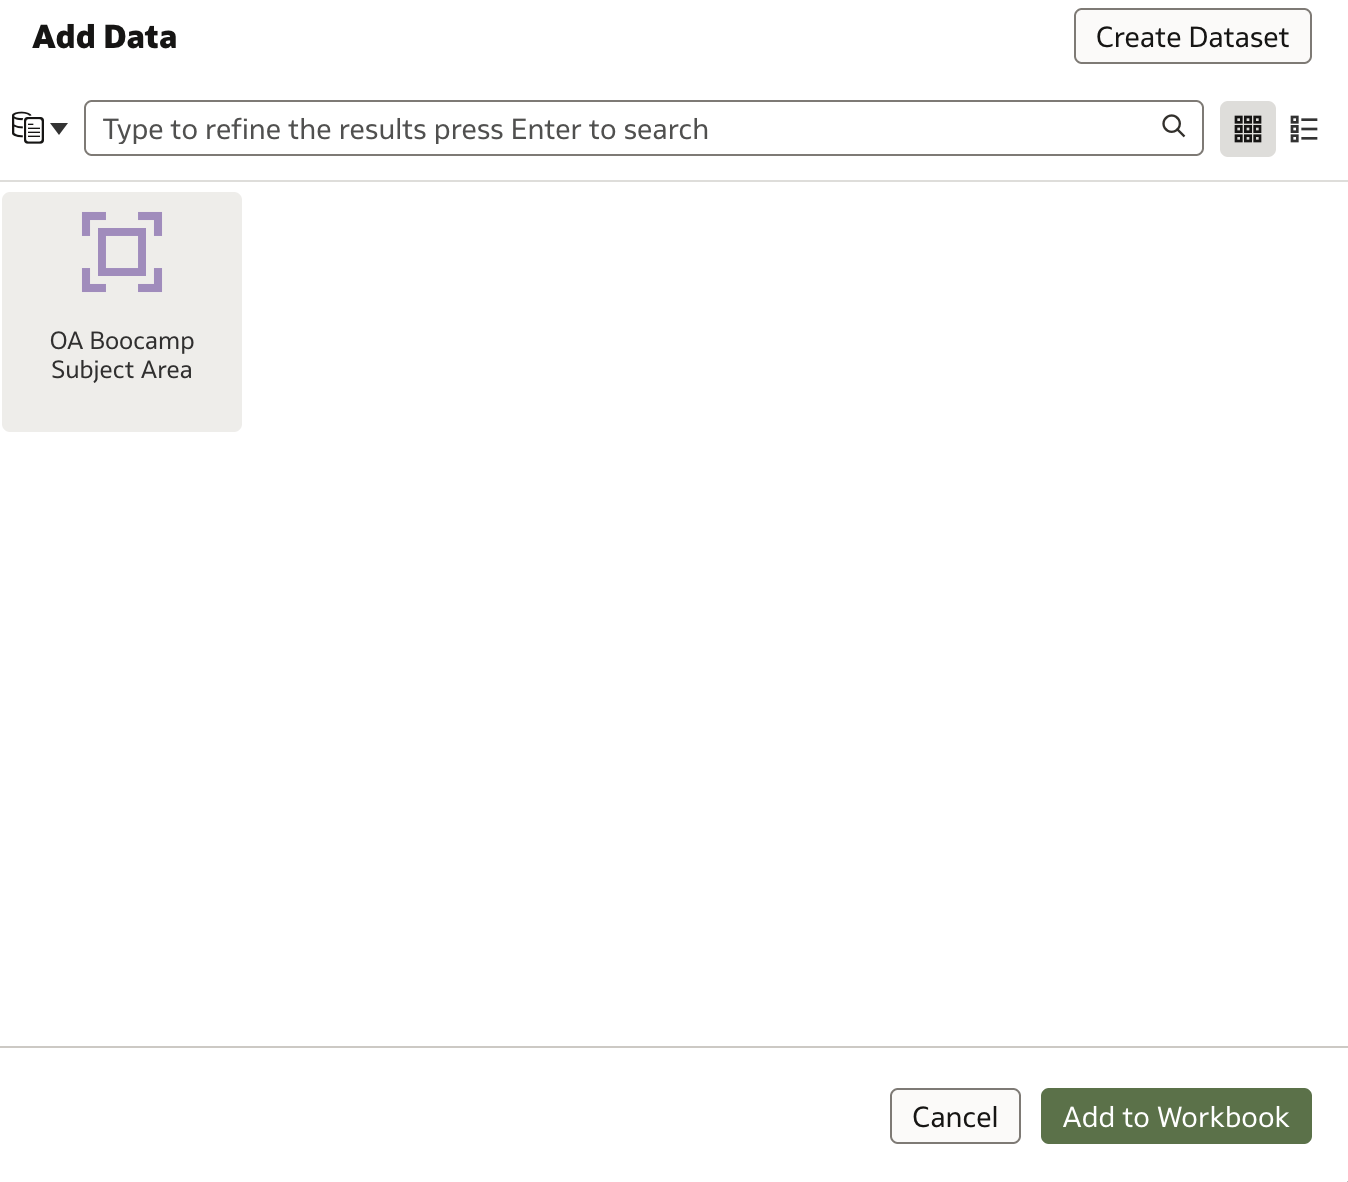
In the Add Data dialog, search for your newly created Subject Area and click Add to Workbook.
Select a few columns, such as:
D Customer.Customer SegmentD Orders.ChannelF Revenue.# of OrdersF Revenue.# of ProductsF Revenue.Revenue
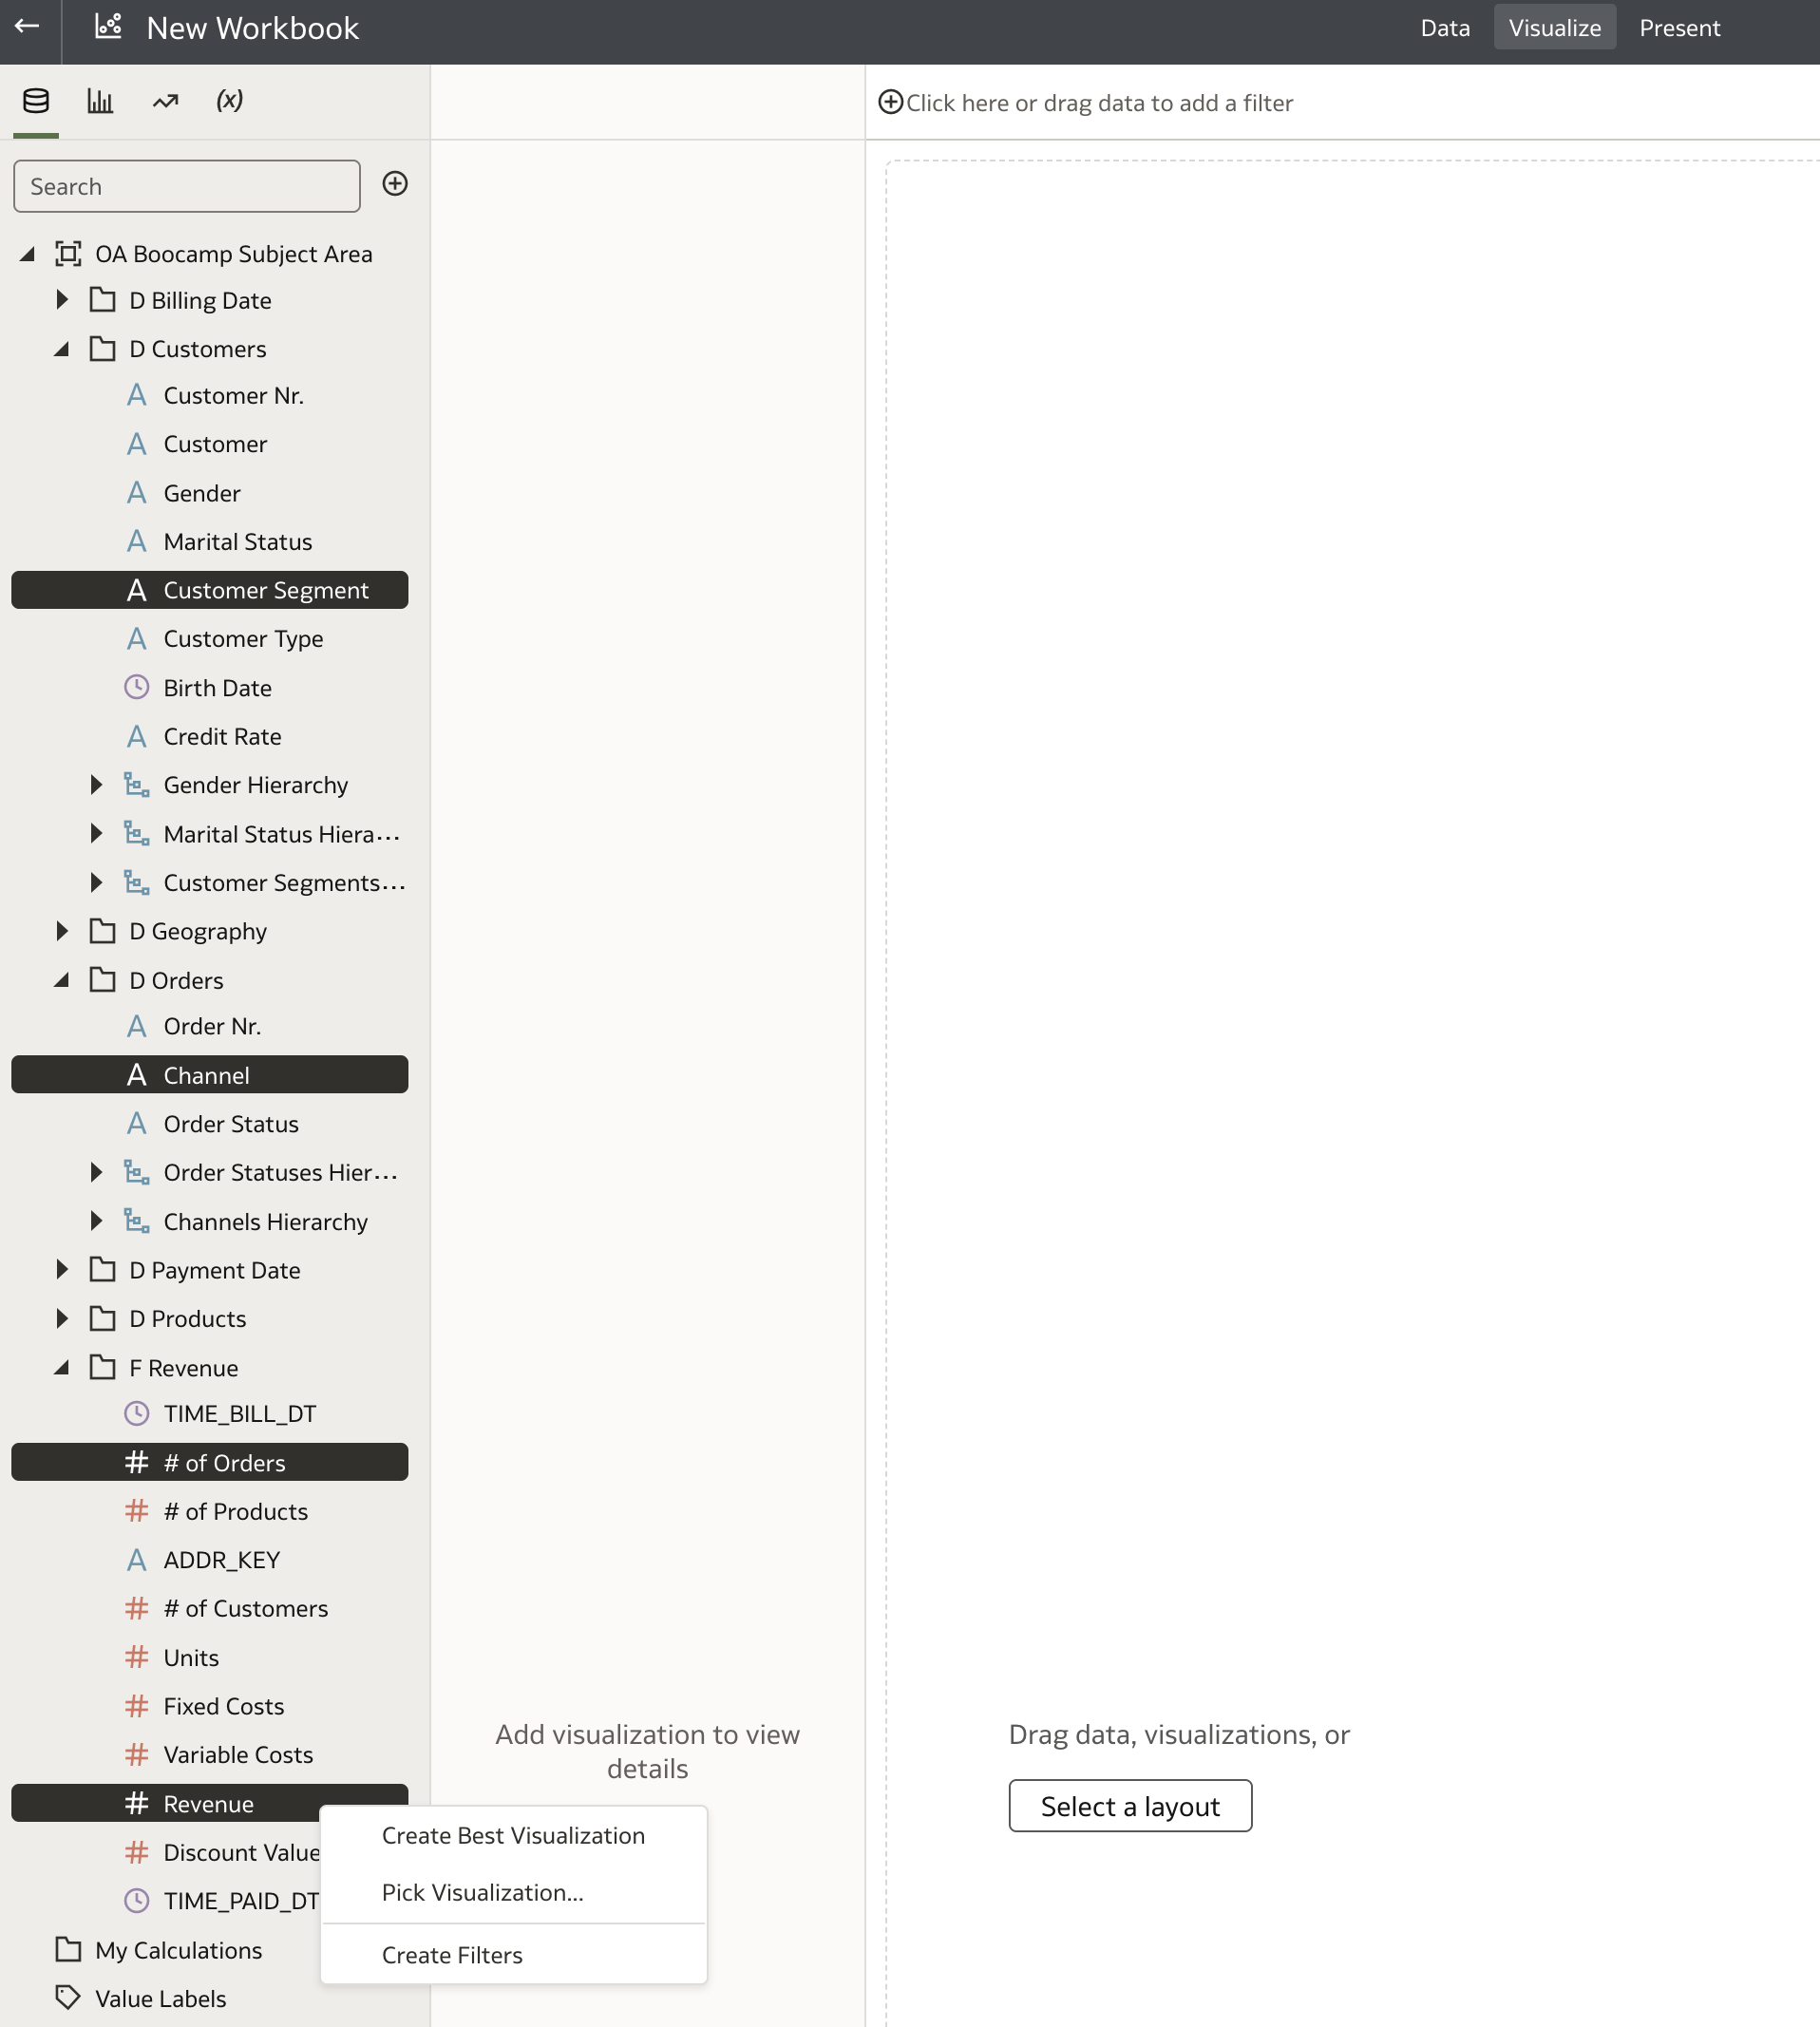
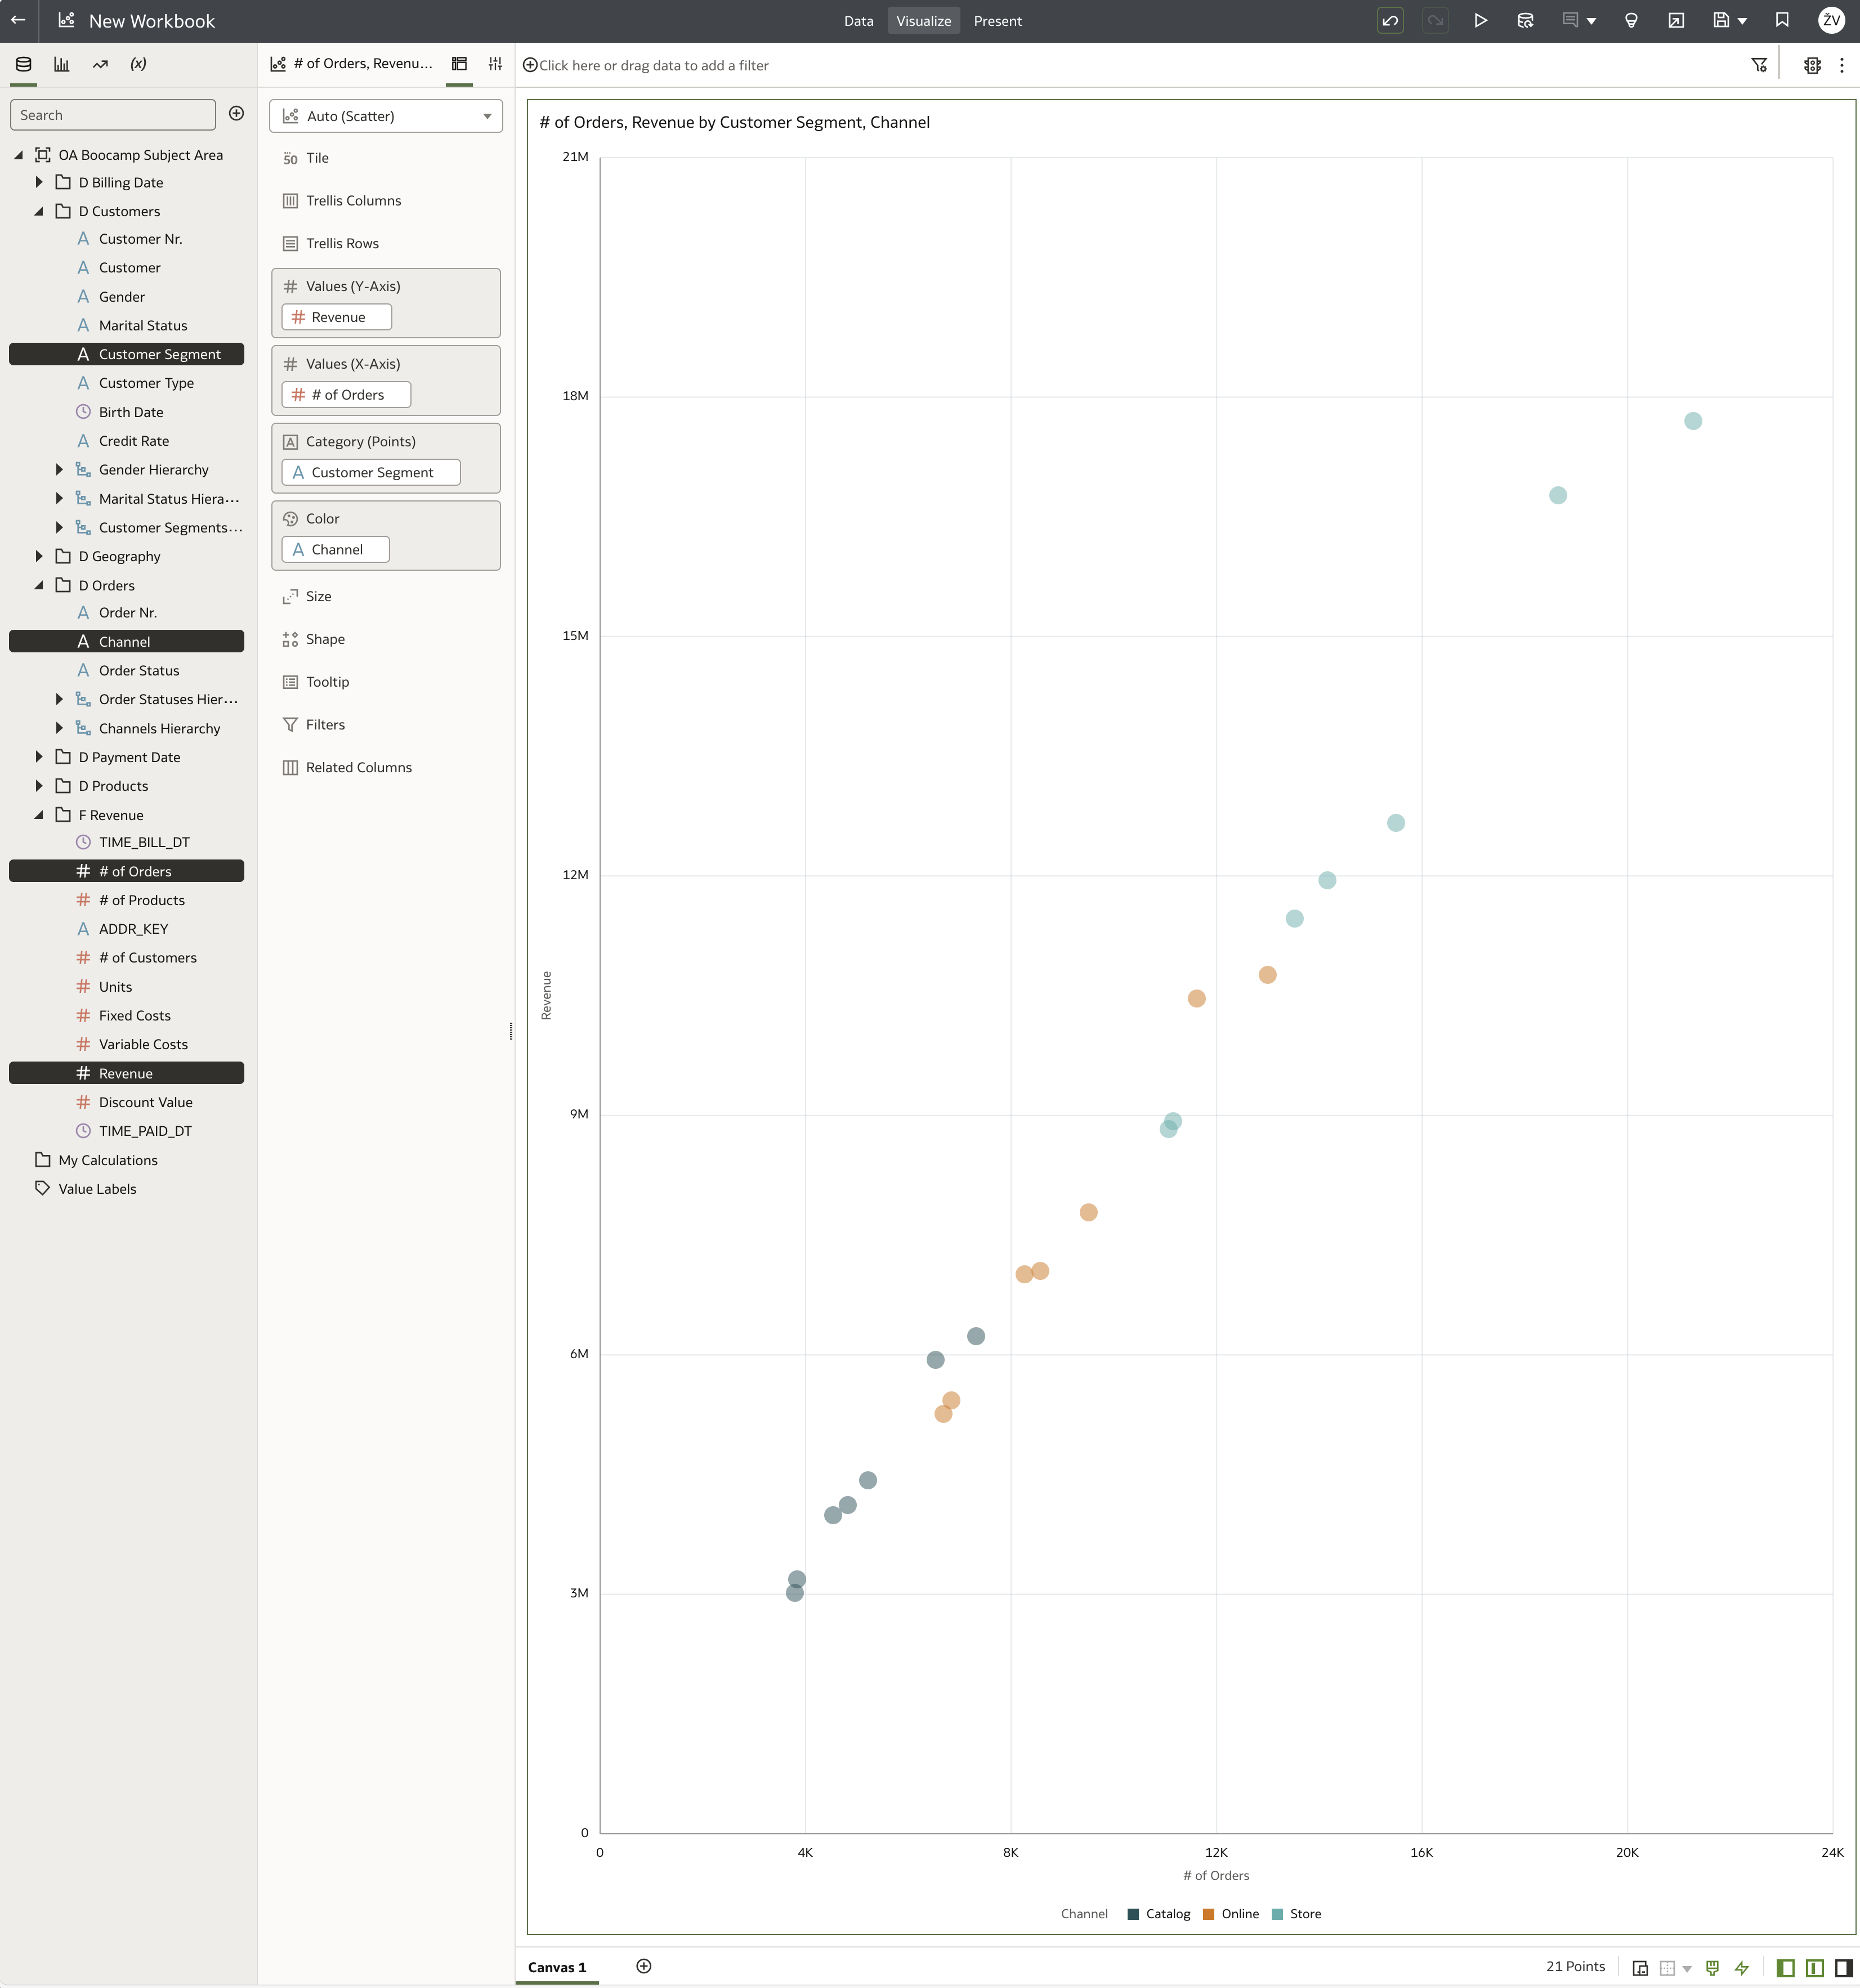
Right-click on any selected column and choose Create Best Visualization.
If your model is set up correctly, Oracle Analytics will automatically generate a meaningful chart — in this example, a scatter chart.
This concludes our walkthrough of the Presentation Layer in Oracle Analytics Semantic Modeler. Throughout this session, we have:
- Created a system connection and initialized the Semantic Modeler.
- Built the Physical and Logical Layers with facts and dimensions.
- Designed and deployed a new Subject Area within the Presentation Layer.
- Successfully tested the model in Oracle Analytics.
Mastering the Presentation Layer is essential for delivering a polished, user-friendly data experience that empowers business users to explore and analyze data confidently. In the next session, we will delve deeper into advanced topics that are key to building powerful and flexible semantic models.