Oracle Analytics meets AI: Talk to Your Data with Ask BI

This post introduces Ask BI, Oracle Analytics Cloud’s conversational interface for exploring data using natural language. It shows how users can ask business questions, refine their analysis through follow-up prompts, and receive answers and visualizations based on governed OAC data. Ask BI makes analytics more accessible by allowing users to focus on the questions they want answered rather than on how to build the analysis.
For a long time, searching in an analytics platform meant finding an object: a workbook, a dashboard, a dataset, perhaps a visualization someone had already created. That remains useful, but it is not always where an analytical question starts.
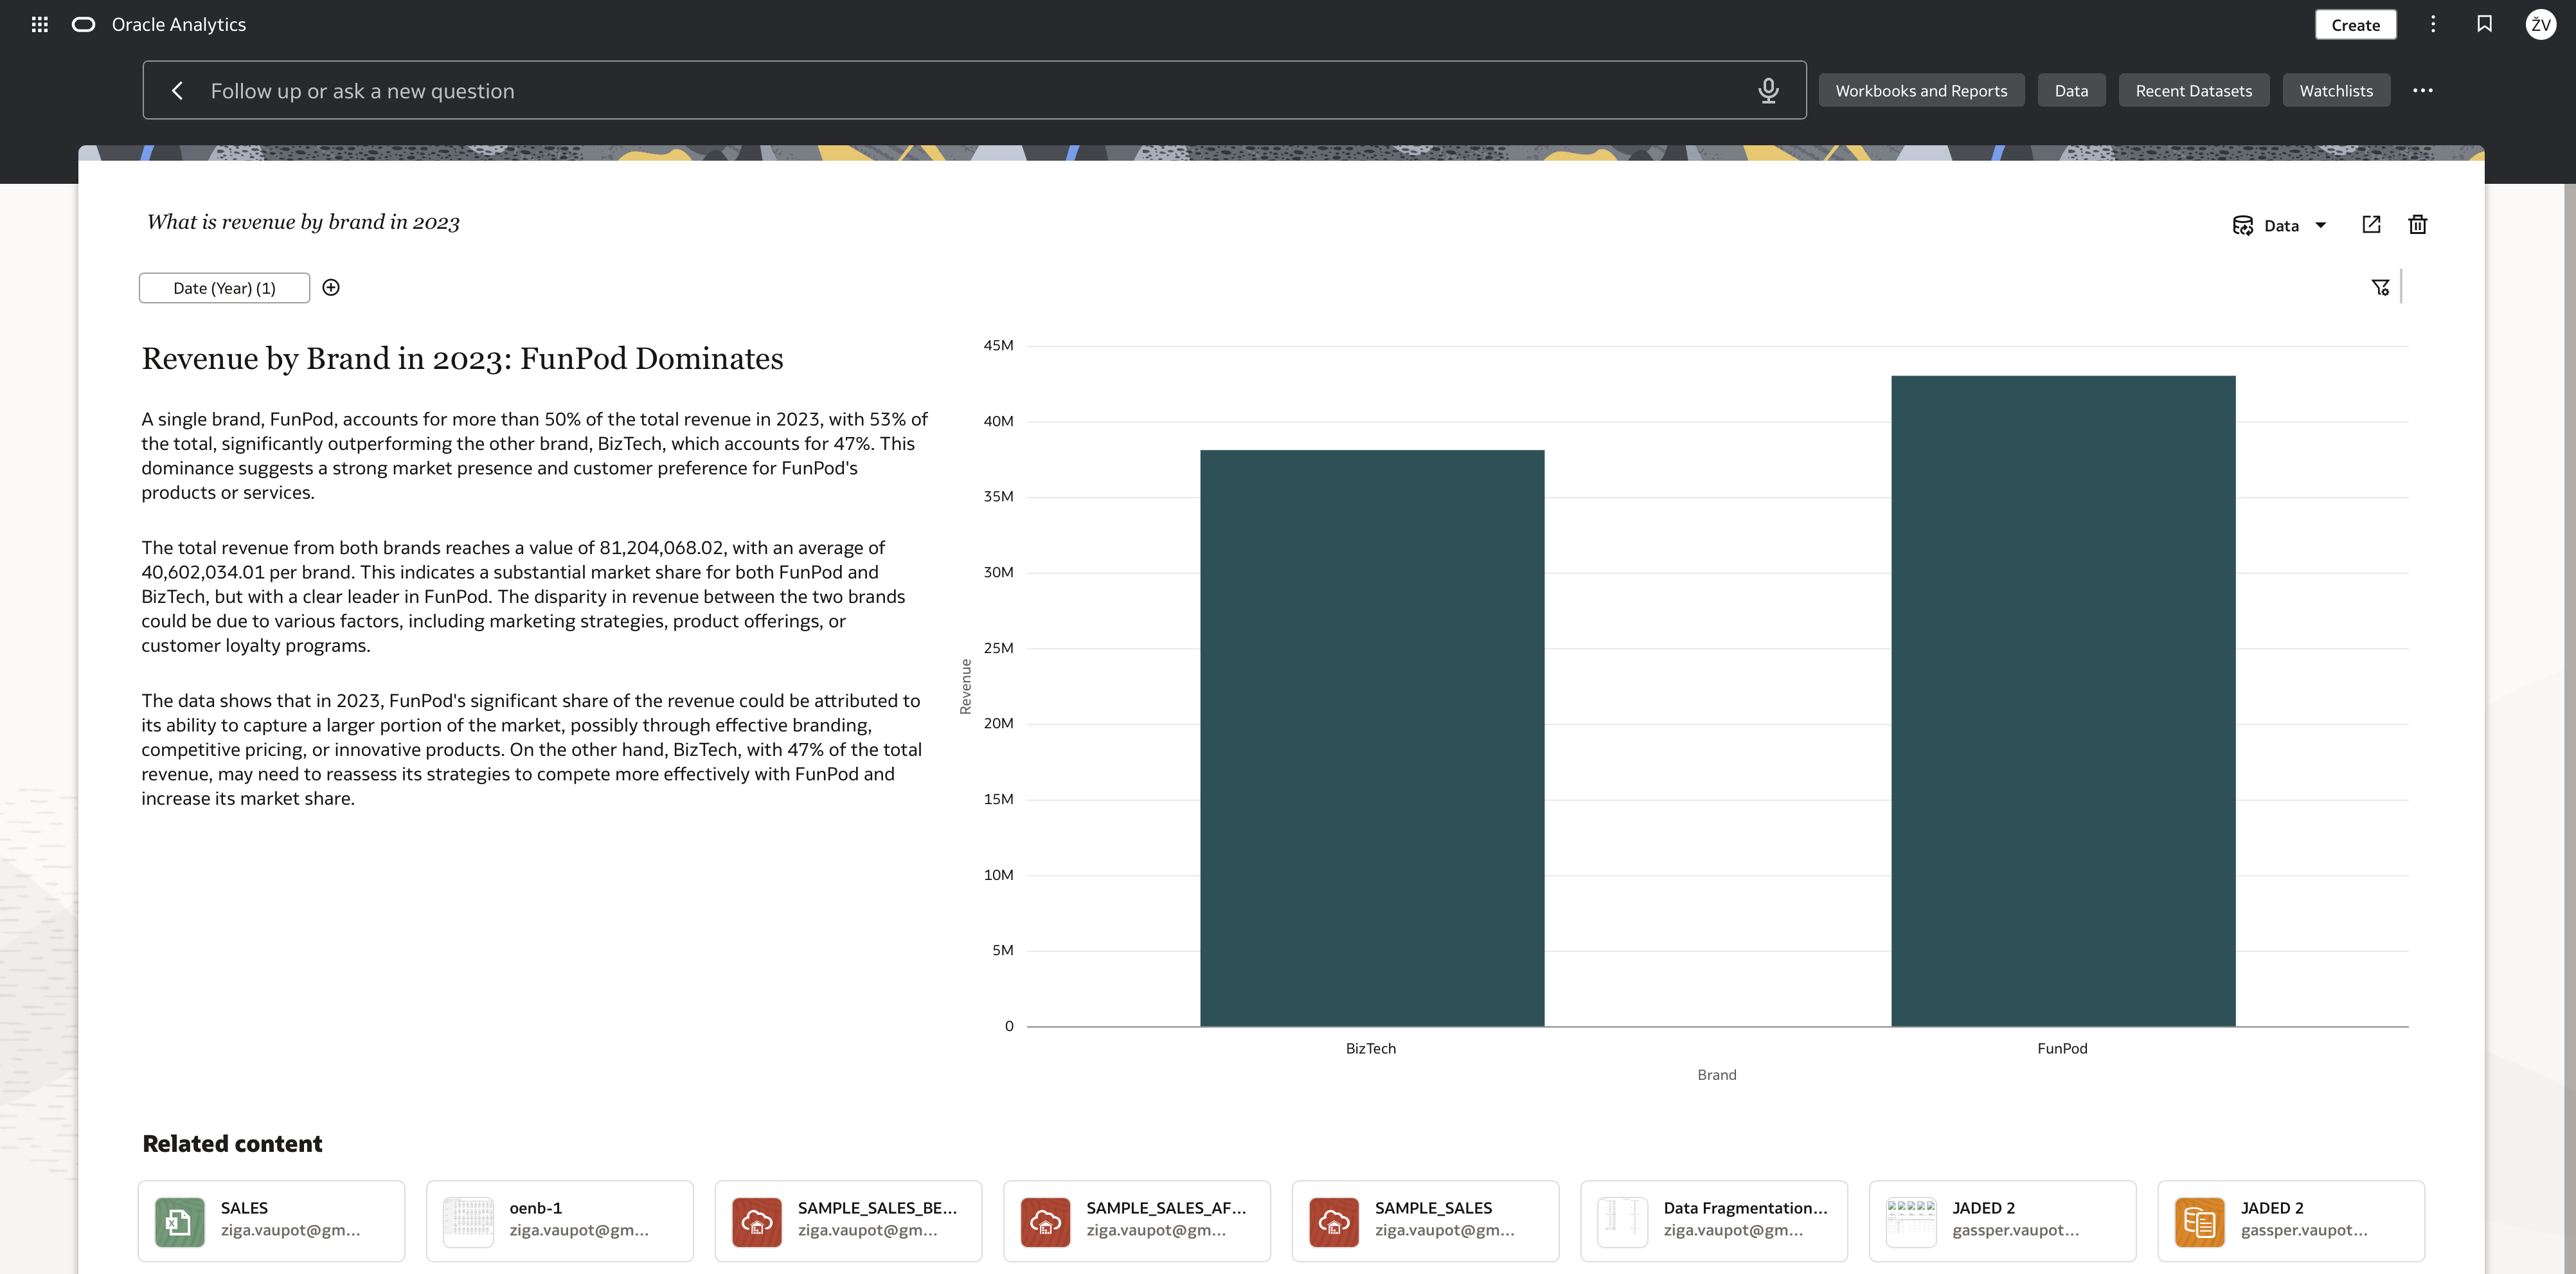
Often the question comes first: What was revenue by brand in 2023? Then comes the next question: Drill into BizTech and show sales by line of business. And then another: Focus on Communication and compare sales and profit by region.
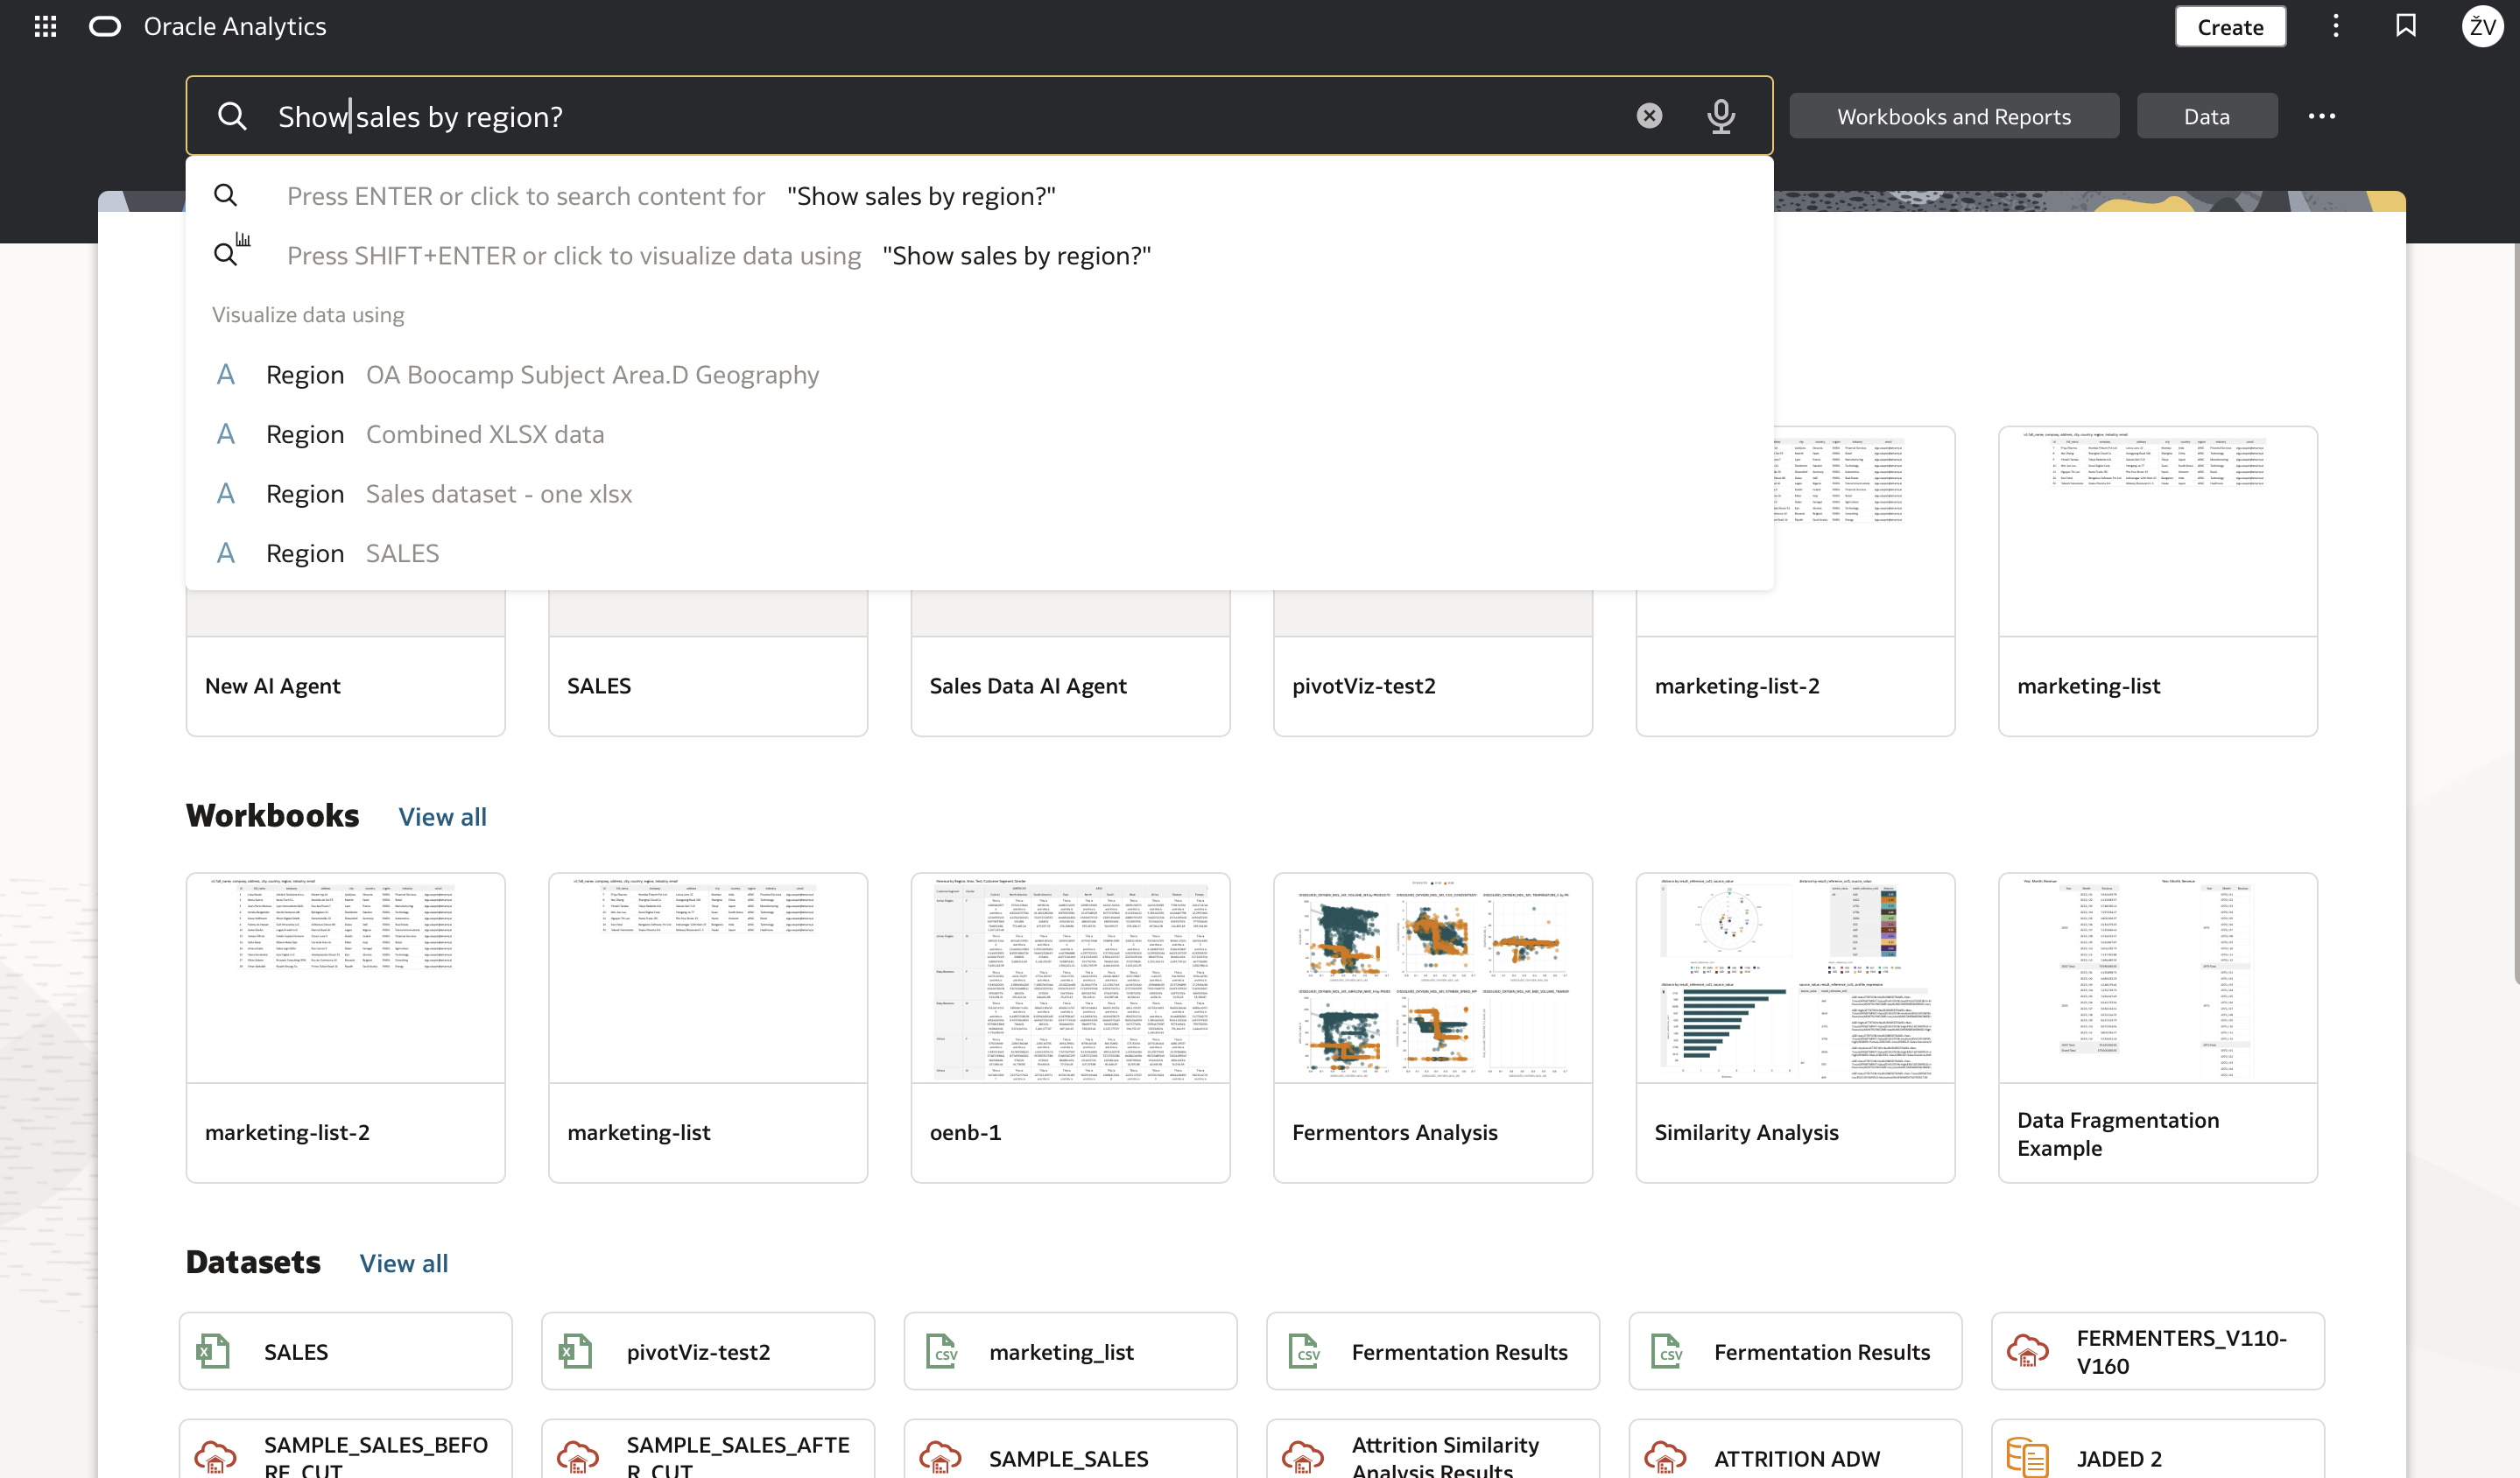
This is the experience that Ask BI, available from the Oracle Analytics search bar, is designed to support. It lets users search for content and ask questions of prepared data in the same place. Rather than treating a request as a route to one existing report, Ask BI can turn it into an interactive analysis that evolves with the conversation.
Search is becoming an analytical starting point
The familiar search bar is an excellent entry point because it is already where users go when they do not know exactly where something lives. With Ask BI, the same entry point can also be used to express an analytical intent in natural language.
For example, a prompt such as What is revenue by brand in 2023? can produce the first visualization. The important part is what happens next: the answer is not a dead end. You can continue with follow-up requests, narrow the scope, change the level of detail, and add another measure.
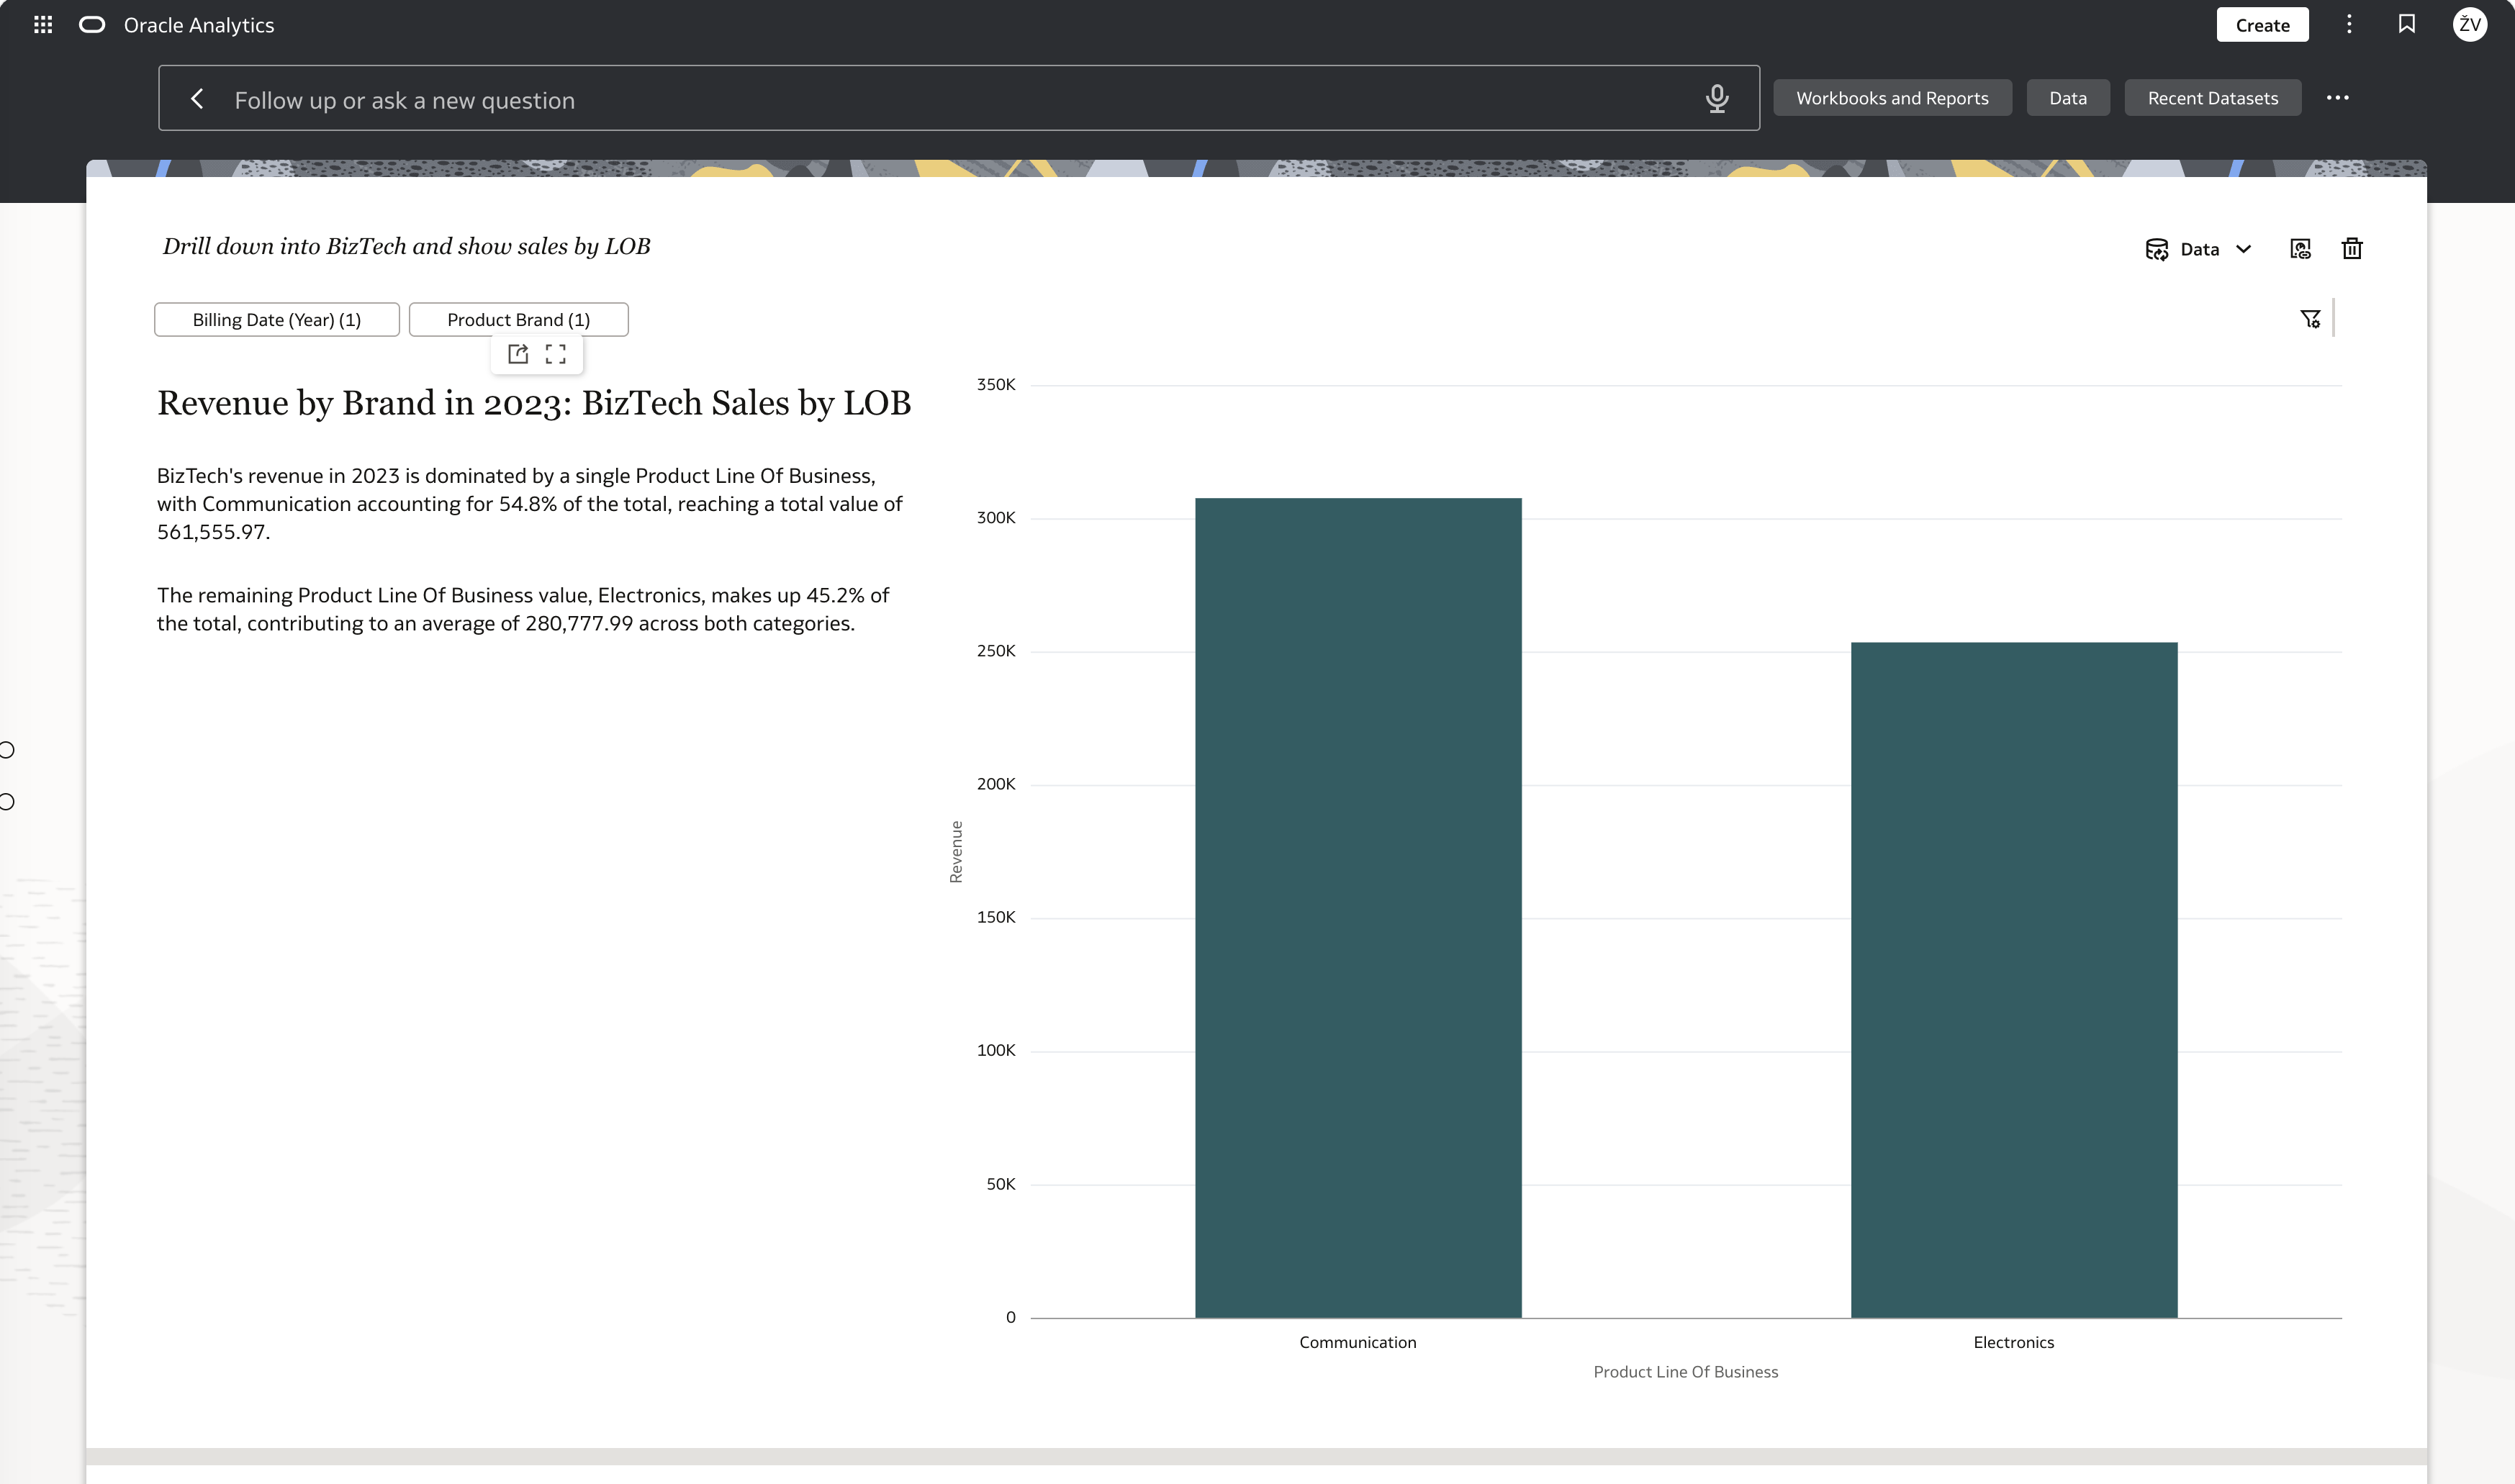
This makes the interaction closer to a conversation with the data than a sequence of separate searches. A follow-up such as Drill down into BizTech and show sales by LOB carries the analytical direction forward instead of forcing the user to begin again in a new canvas.
Good answers start with prepared data
Natural-language access does not remove the need for data preparation; it makes that preparation even more important. Ask BI works with indexed data, so the first step is to decide which datasets should be available for this experience.
In the dataset settings, define where an indexed dataset can be used and the language that should be supported (unfortunately for us Slovenians, Slovenian language is not one of them). You can also control the indexing frequency and schedule. This is a practical governance point: not every dataset needs to be exposed in every conversational context, and the index should be refreshed at a cadence that matches how often the data changes.
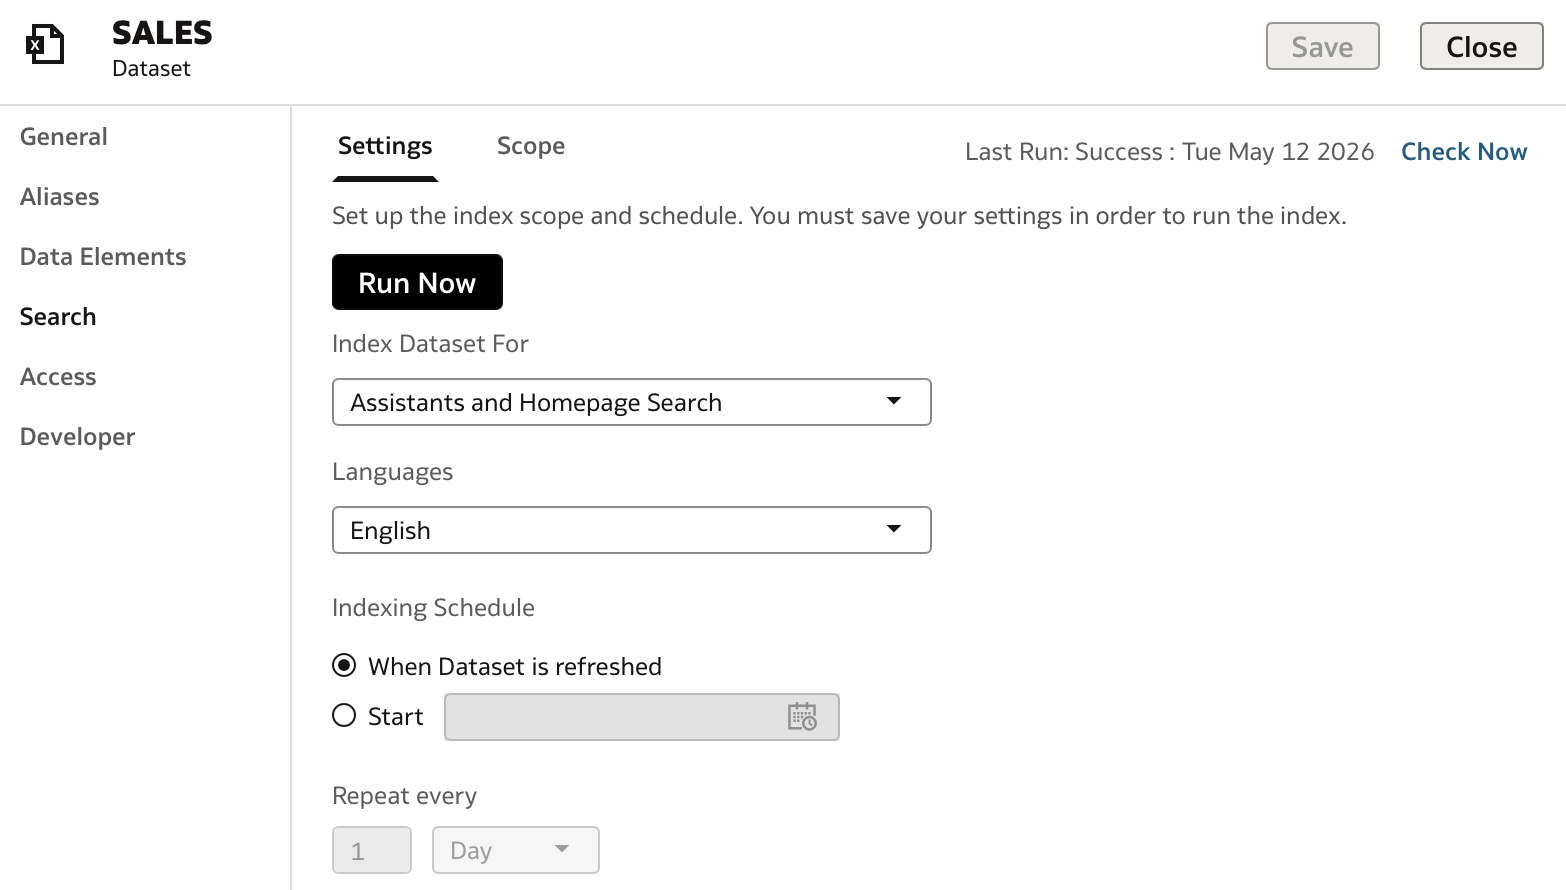
The next decision is scope. Choose what will be indexed: metadata, data, or both. Metadata helps Ask BI understand the shape of the dataset - its columns, measures, and business terminology. Indexing data can add useful context for the questions users actually ask. Synonyms are equally valuable: business users may say revenue, sales, or turnover even when the model uses only one of those terms.
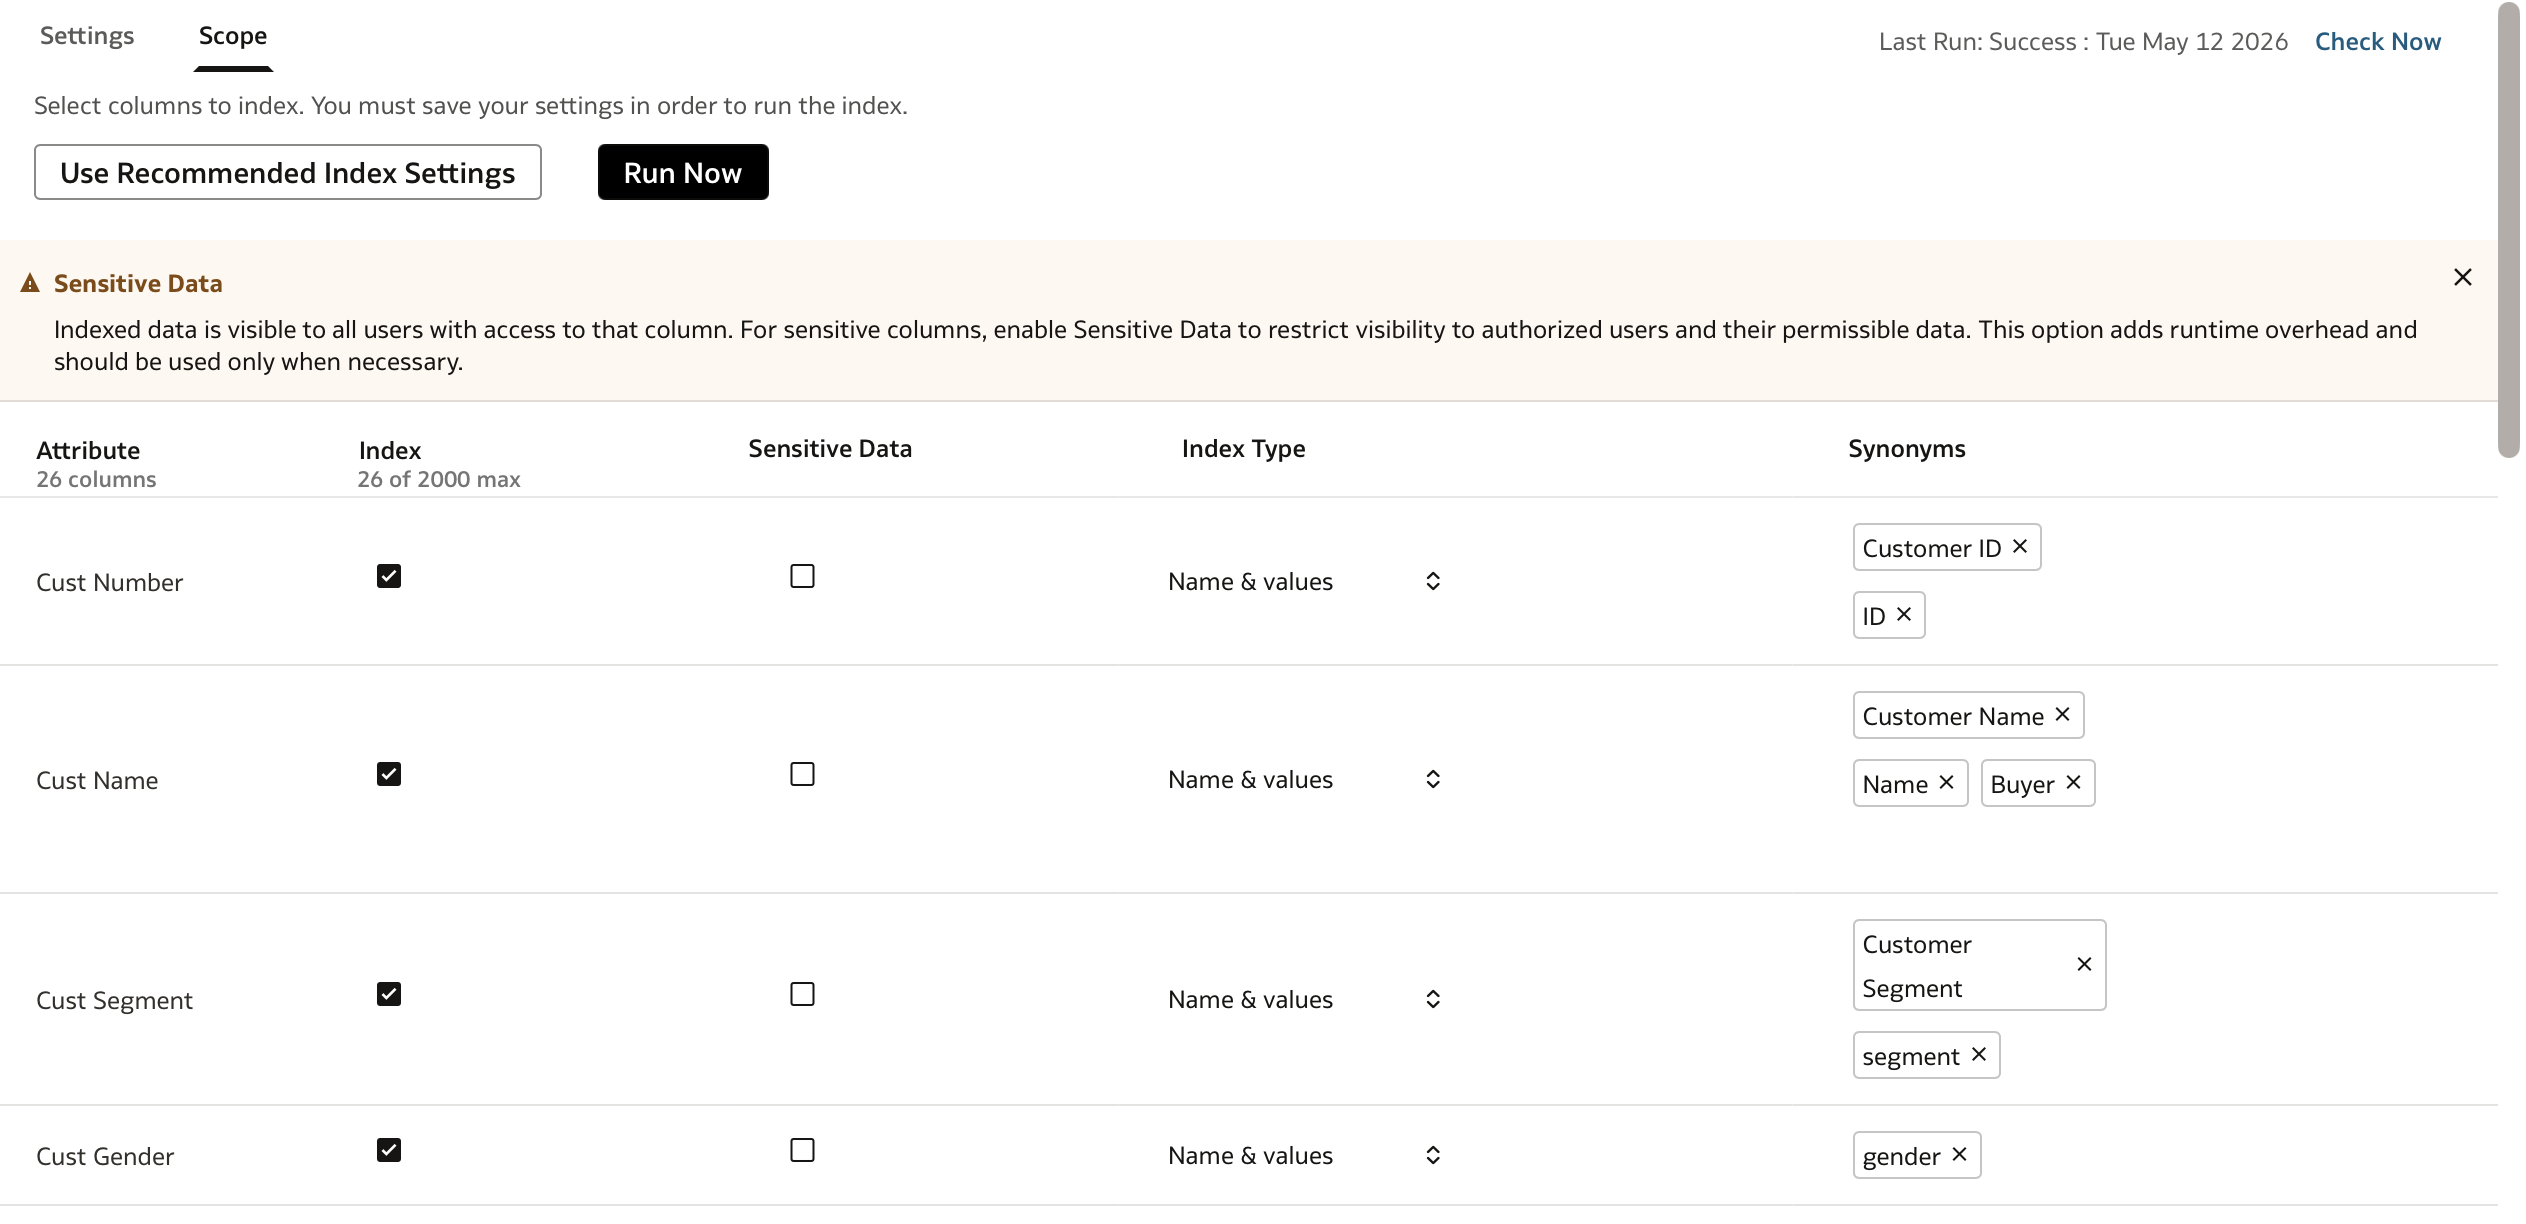
This is where a semantic mindset pays off. Clear names, well-defined measures, sensible descriptions, and business-friendly synonyms give Ask BI a much better foundation. AI can make the interface more forgiving, but it should not be expected to compensate for ambiguous measures or an undocumented dataset.
Refine the analysis naturally
Once the data is ready, the conversation can move from a broad question to a more focused analysis. Consider this progression:
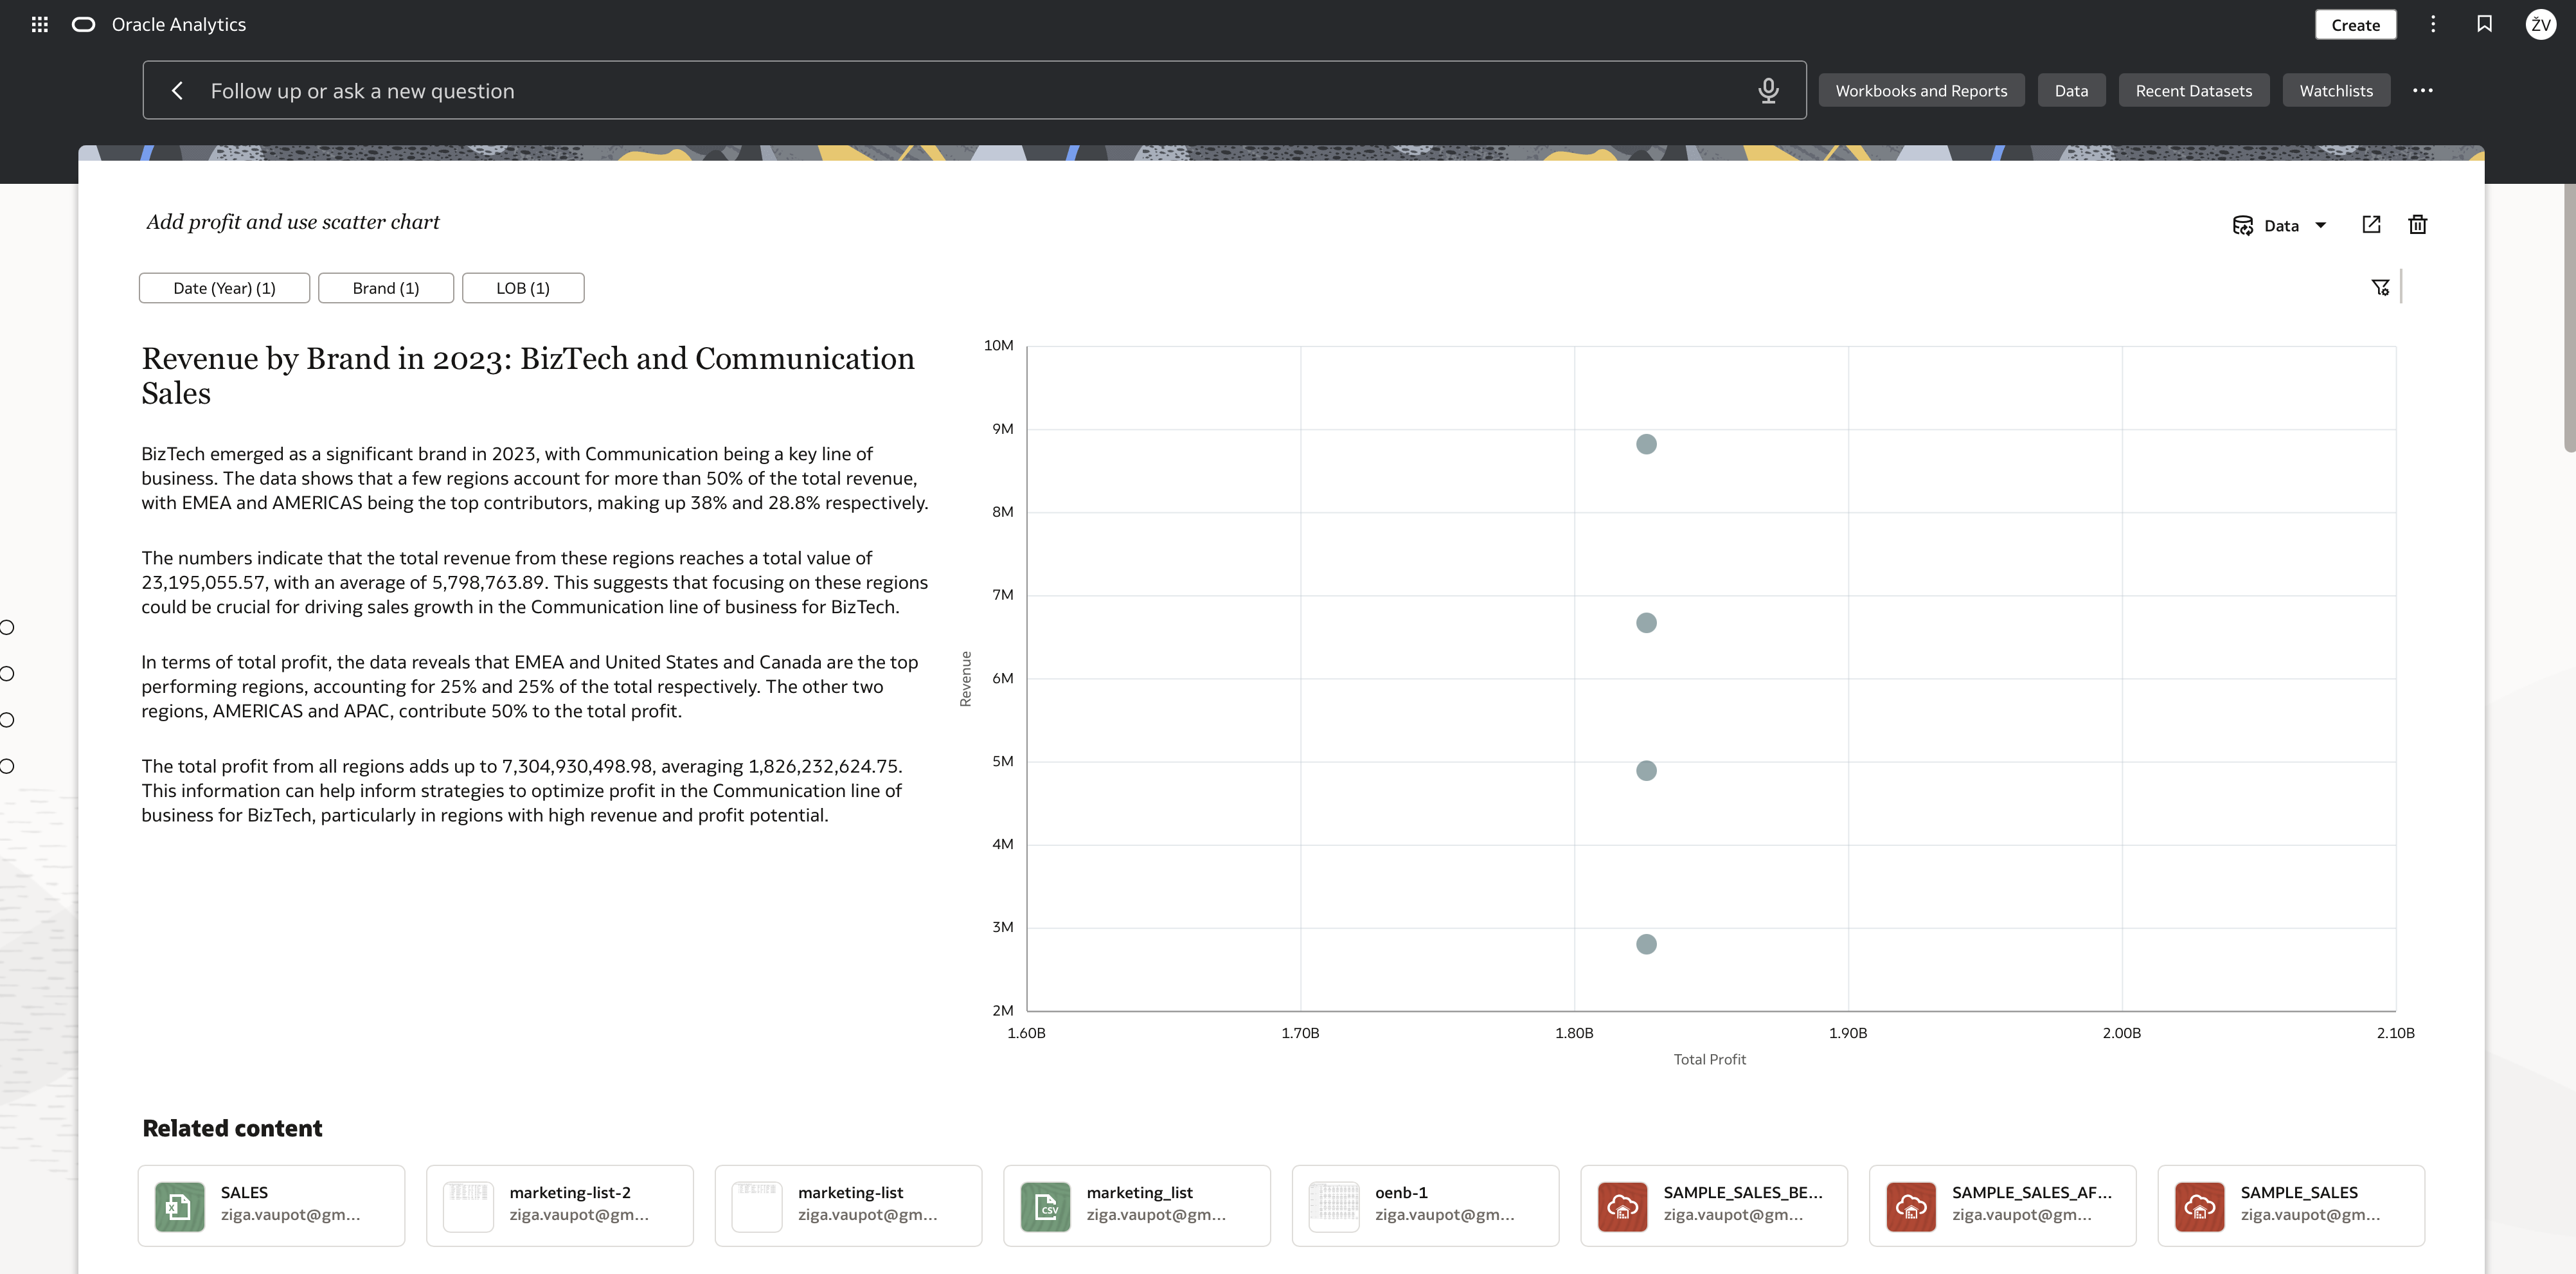
What is revenue by brand in 2023?Drill down into BizTech and show sales by LOB.Let's analyze Communication only and show sales and profit by region.Add profit.
Each prompt is simple, but together they form a real analytical path. The user is not asking for a prebuilt dashboard; they are shaping the analysis as their understanding develops.
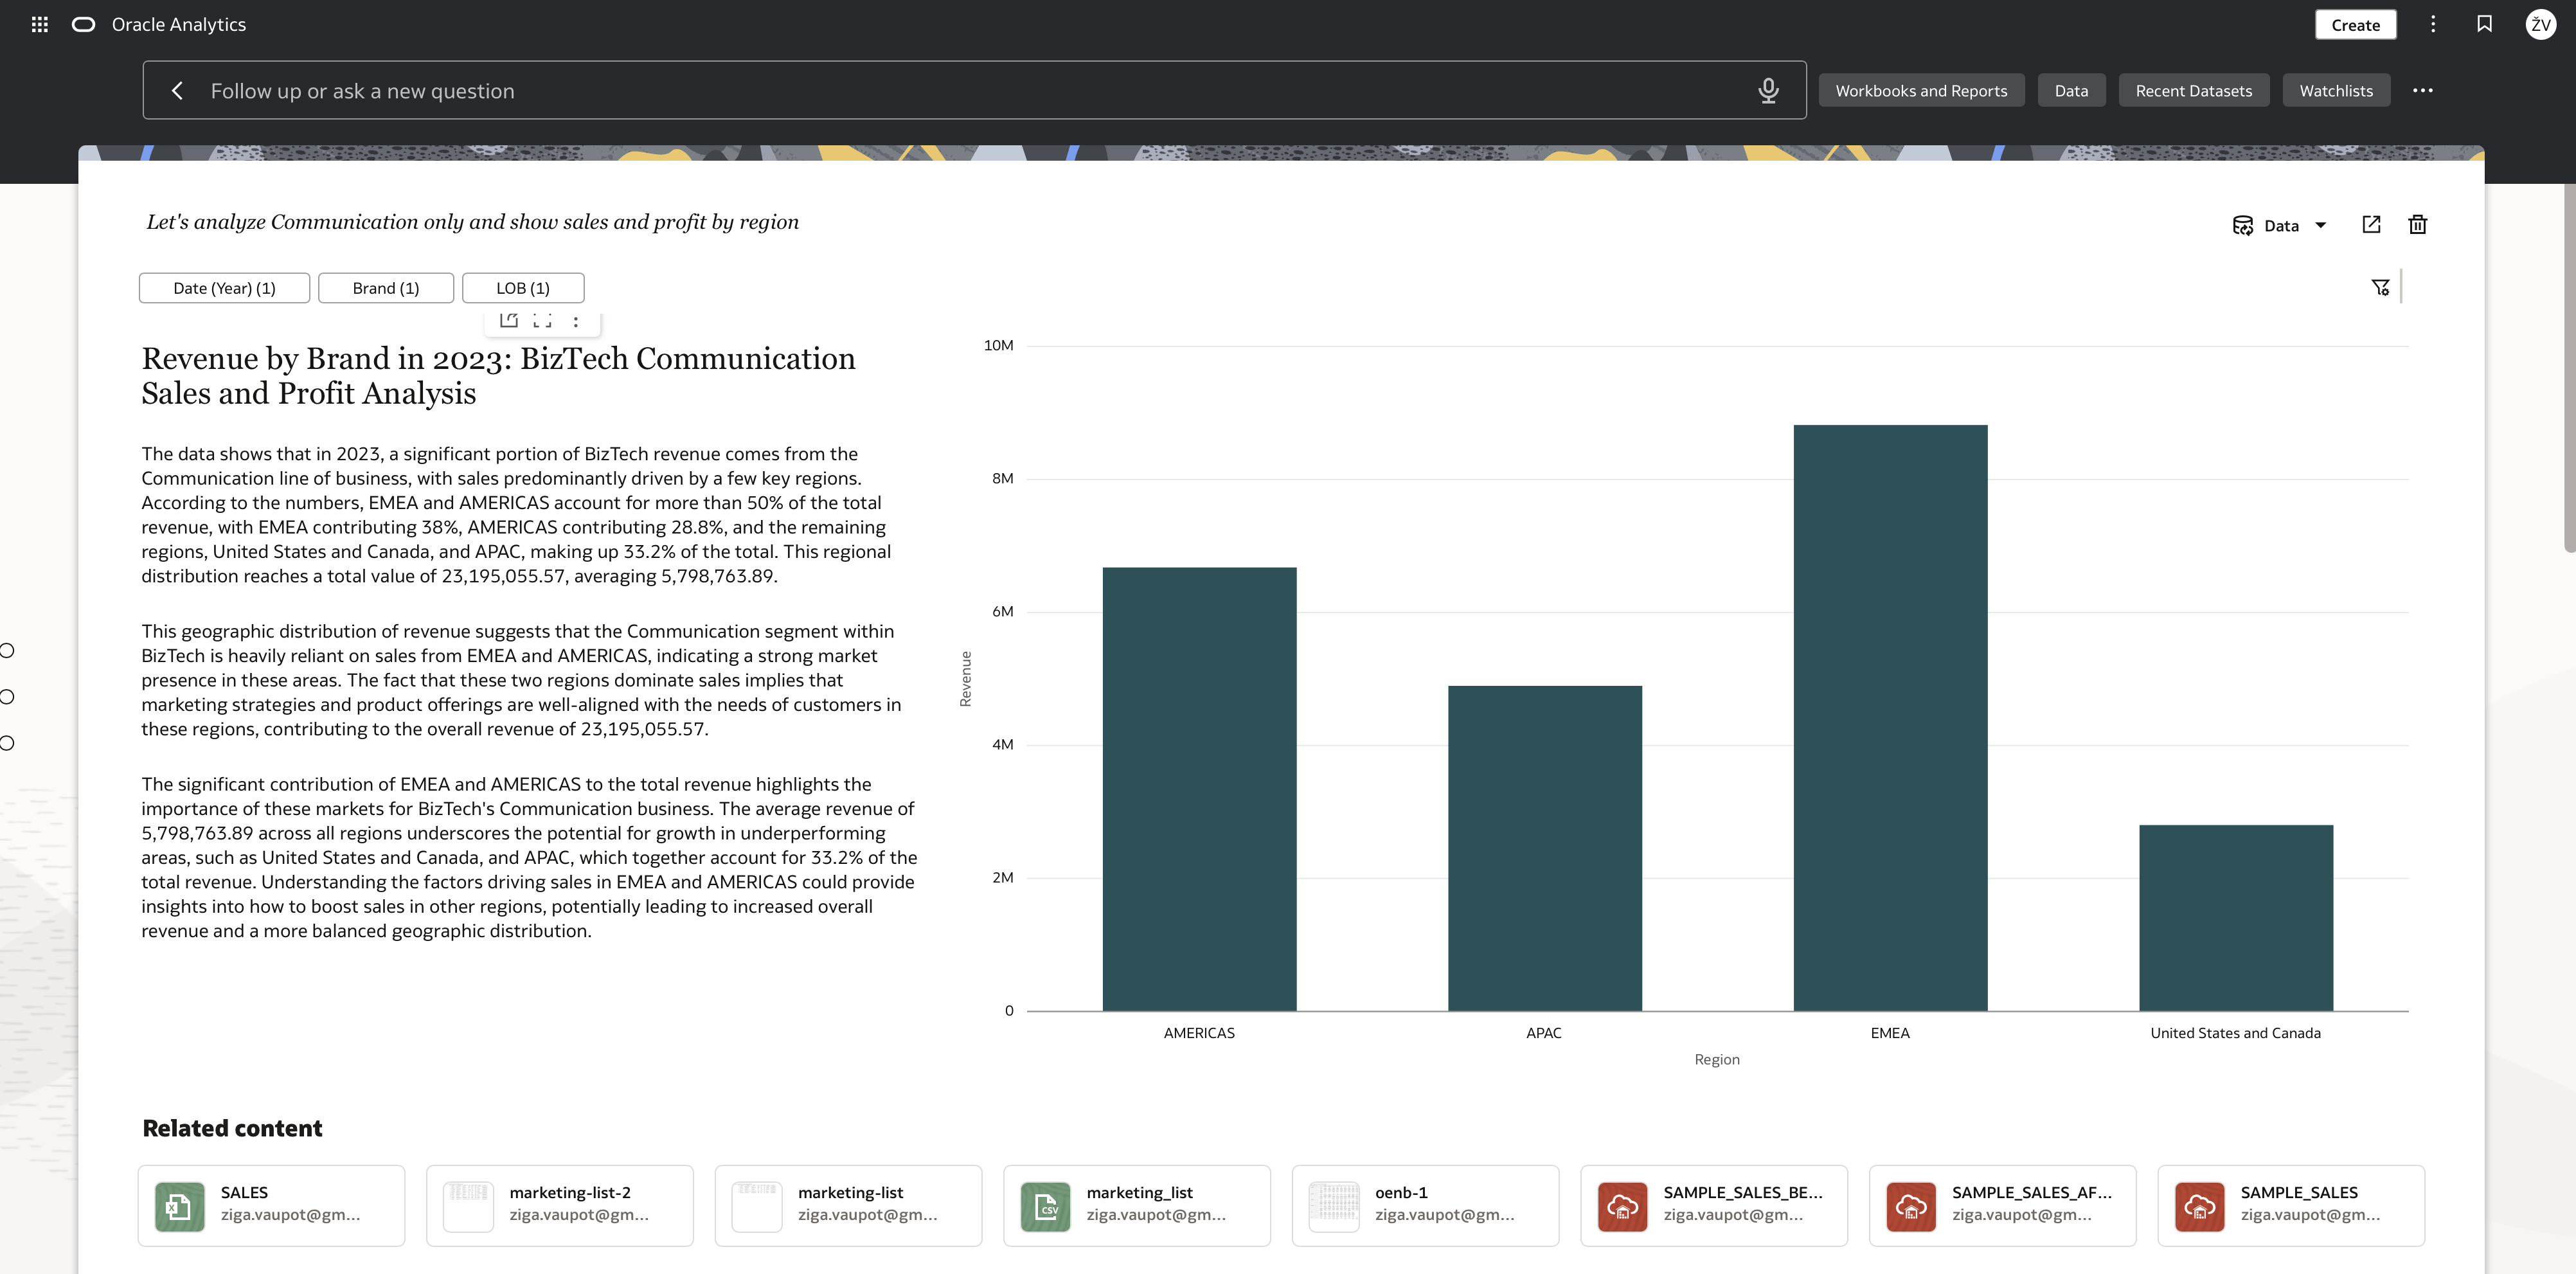
The result can include more than a single chart. Ask BI can assemble a report with several visualizations, which is particularly helpful when a question has more than one useful angle. The conversation remains active while the report is visible, so the user can still adjust filters, change the dataset if the wrong one was selected, and continue asking questions.
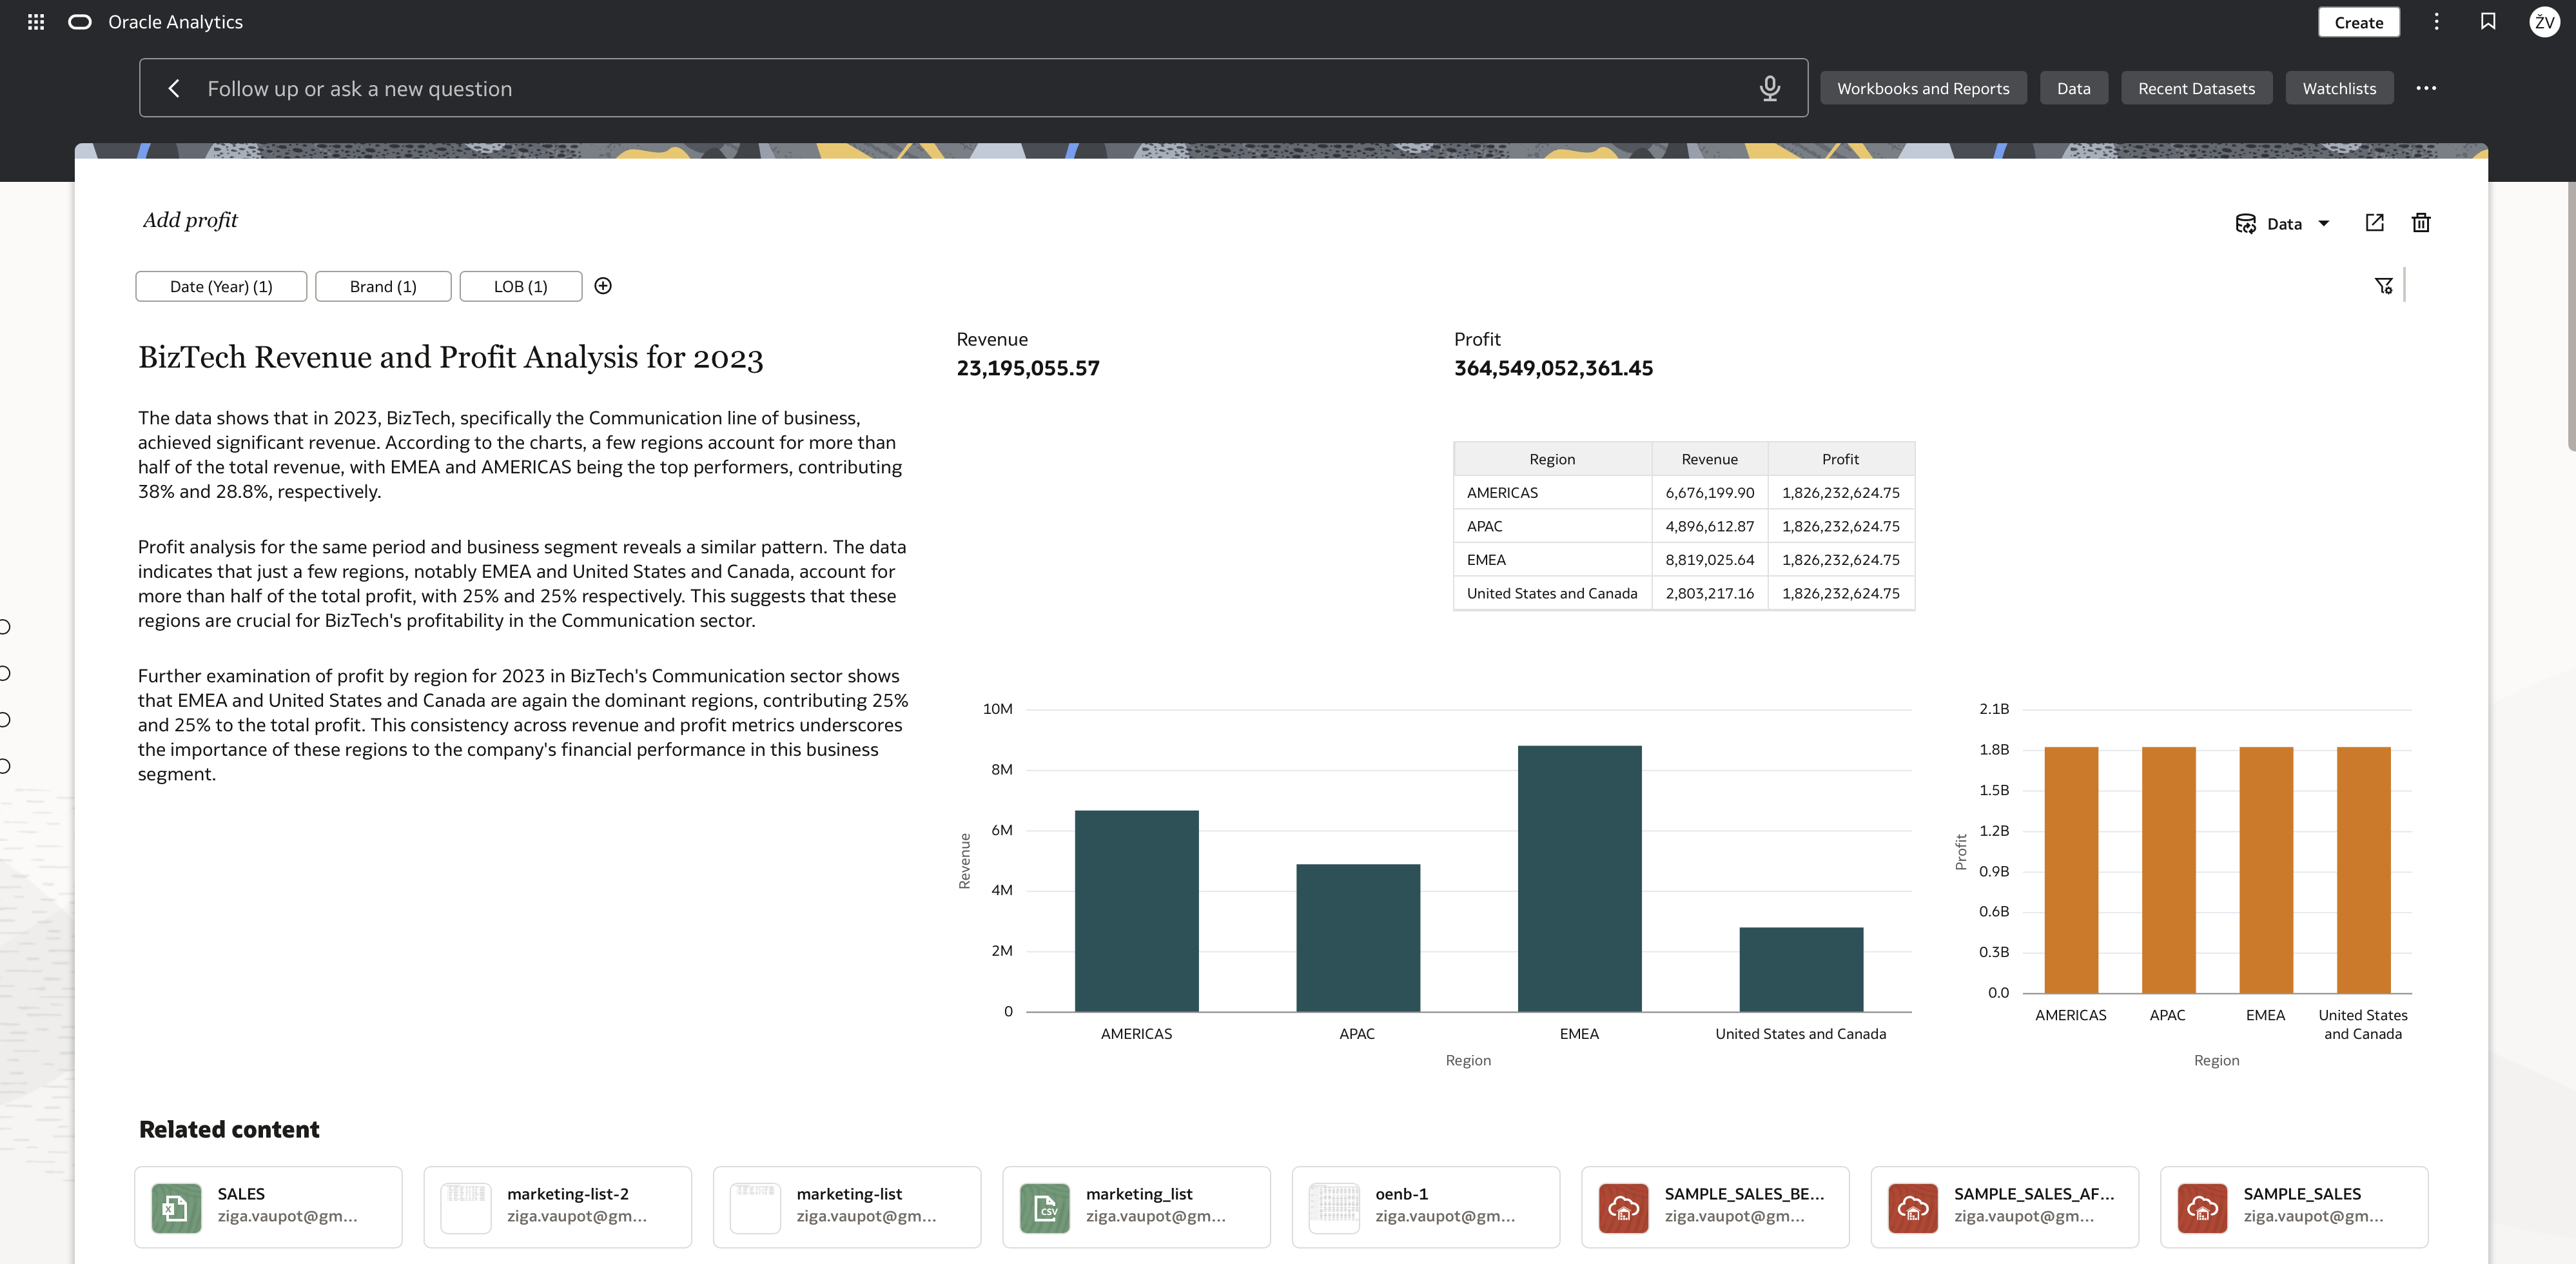
That combination matters. Conversational does not mean giving up familiar analytical controls. Filters remain available, and the result can be opened in a new workbook when it deserves further exploration, refinement, or sharing.
A few practical habits
Ask BI is most useful when it is treated as a way to start and steer an analysis, not as a replacement for analytical judgement.
- Begin with a clear business question and refine it one step at a time.
- Prepare the datasets deliberately: review names, descriptions, measures, and synonyms before indexing.
- Confirm the dataset and filters behind the answer, especially when similar sources exist.
- Use the generated report as a starting point, then open it in a workbook when the analysis needs to become a reusable asset.
The real shift is small but meaningful. Search is no longer only about locating existing analytics content. It can become the first line of an analytical dialogue - one where users can ask, refine, filter, and explore without first translating every business question into a dashboard navigation path.