
This blog post has been prepared and written in cooperation with Joel Acha, Oracle ACE Associate & Senior Business Solution Architect at Qubix Intl.
Parameters in Oracle Analytics
The use of parameters in OBIEE (the predecessor of Oracle Analytics) is a feature that made it possible to add session personalisation to the user experience. This feature has been missing in Data Visualisation workbooks until now. The March 2023 Oracle Analytics Cloud update has a few product updates but the most prominent new feature of this update is undoubtedly the introduction of parameters to Data Visualisation workbooks.
About Variables in Oracle Business Intelligence (OBIEE)
We’ll start things off by taking a look at what functionality existed in OBIEE. There are several variable types that could be used to pass static or dynamic values.
- Session Variables are assigned a value when the user signs in to Oracle Analytics and their values persist for the duration of the user session. There are 2 types of Session Variables:
- System Session Variables - These are used by the Oracle BI Server and the Oracle BI Presentation Services for internal purposes.
- Non-System Session Variables - These can be created in the semantic model.
- Presentation Variables - These variables are typically defined in the “front end”.
- Repository Variables - these are also available in the semantic model and can only have a single value at any given time.
- Static - The static value is defined and doesn’t change
- Dynamic - These derive their value at runtime from the results of a SQL query defined in a construct called an initialisation block.
- Request Variable - This variable enables the value of a session variable to be overridden.
- Global Variables - Similar to the Presentation Variable in that this variable is created in the “front end” and can be used to store the results of an intermediate calculation step for example.
Using Parameters in Oracle Analytics
Let’s start off with a look back at the equivalent OBIEE feature. The parameters functionality that has been incorporated into Oracle Analytics Cloud matches with the Presentation Variables functionality described above that have been available in OBIEE.
There is now a new tab in the workbook editor in which you can find the parameters. Repository variables are also accessible in the new parameters tab in addition to parameters created in the workbook screen.
The syntax used to reference a parameter is:
@parameter("parameter name")(default value)
If the parameter has a text data type then the default value should be within single quotes. The name of the parameter (parameter name) should always be within double quotes.
Let's take a look at some examples on how to use Parameters in Oracle Analytics.
Example #1: Using parameters in calculations (Expressions - CASE (Switch))
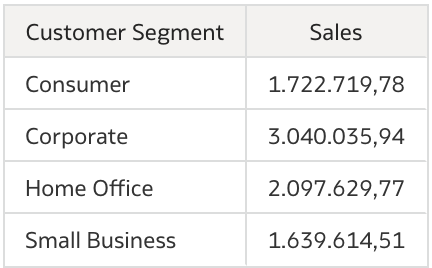
One of the simplest examples of using Parameters in Oracle Analytics is the following. Imagine that you want to abbreviate numeric values in a table.
For example, instead of displaying full number 1.722.719,78 you might want to display value as 1.772,72K or 1,77M. By the way, Oracle Analytics provides this functionality out of the box.
In this case, two things need to happen:
- you have to create a parameter which will store your selection ('no abbr.', 'K' or 'M') and
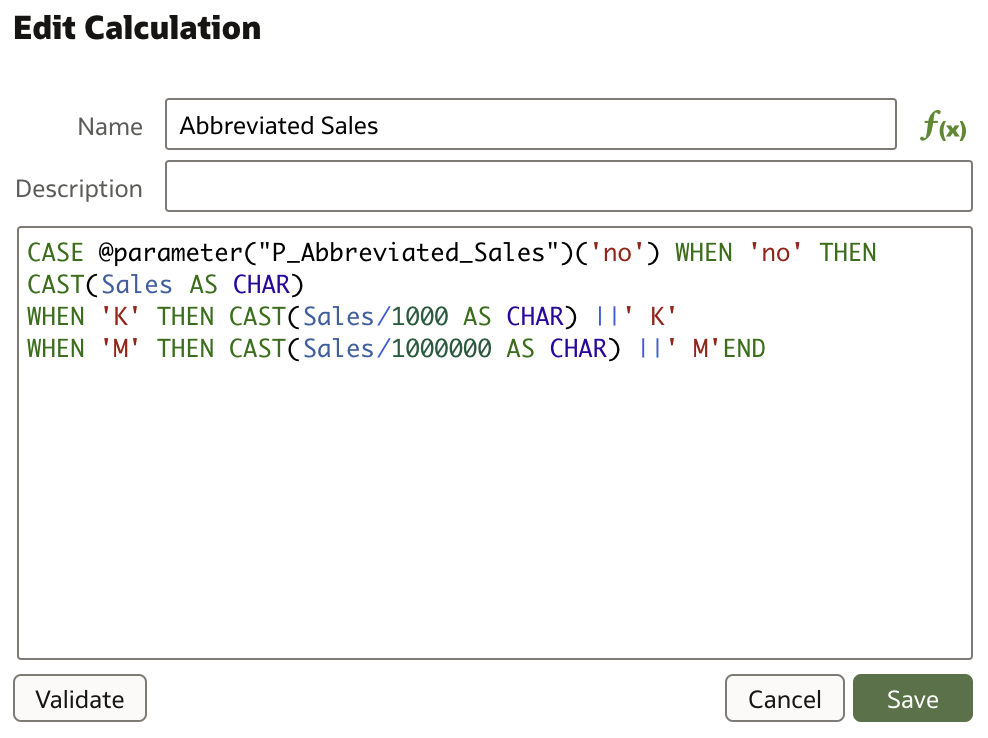
- you need to define a calculation which would use parameter to divide a numeric value with 1,000 or 1,000,000.
So, first, we need to create a new parameter. In your workbook you will find additional menu option Parameters at the top of the main panel.
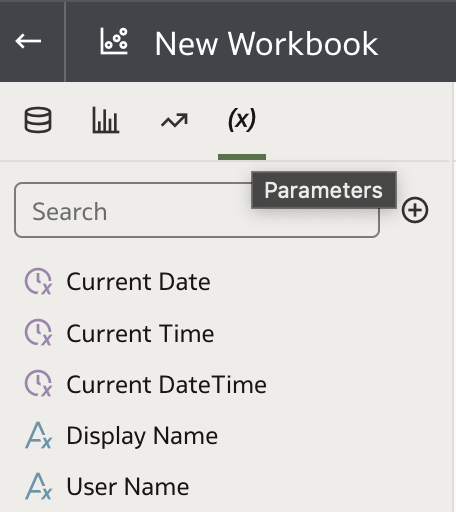
You can create a new parameter simply by pressing + next to the Search field. Parameter that is created in this case is very simple, it is based on the list of values that is manually entered with the initial value set to one of these entered values.
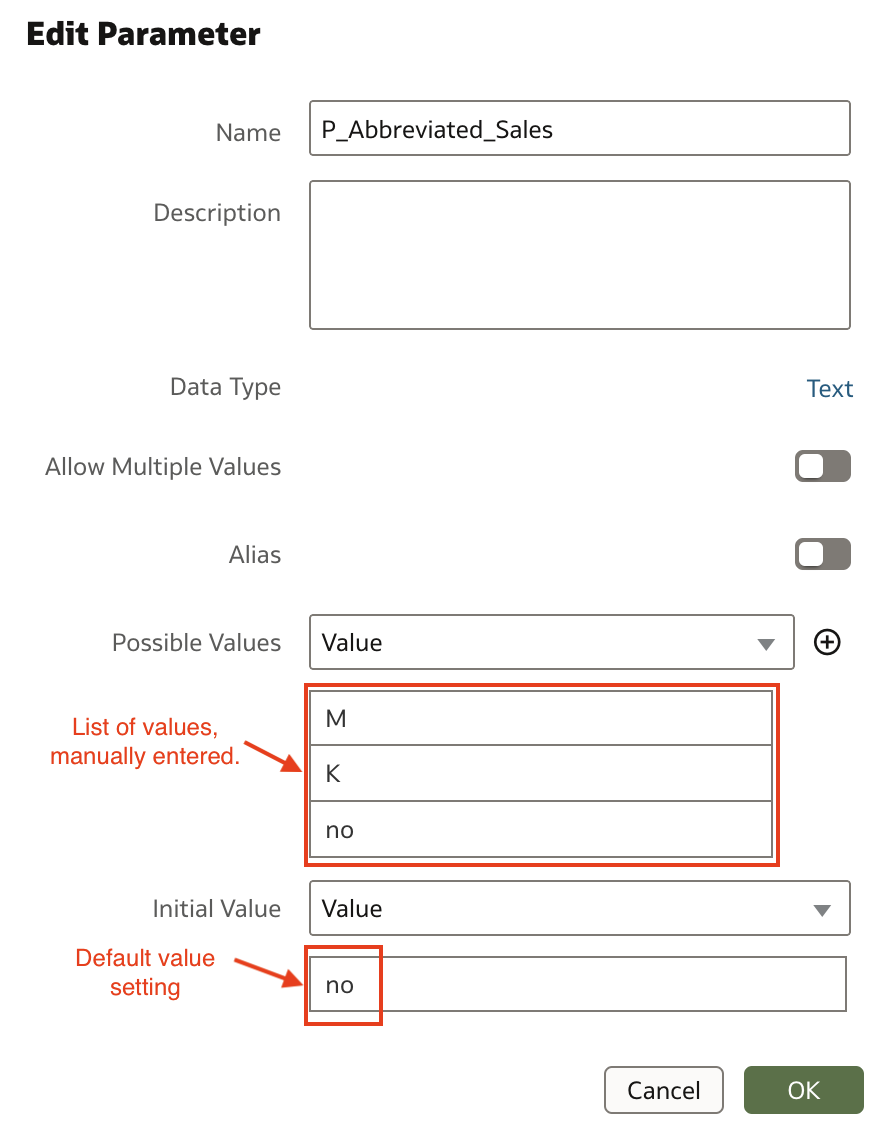
And this is all that is required to define a parameter. Now, we need to create a calculation that would use this parameter.
In analysis above another calculation is created, simply to display selected parameter. For example, new table could look like this:
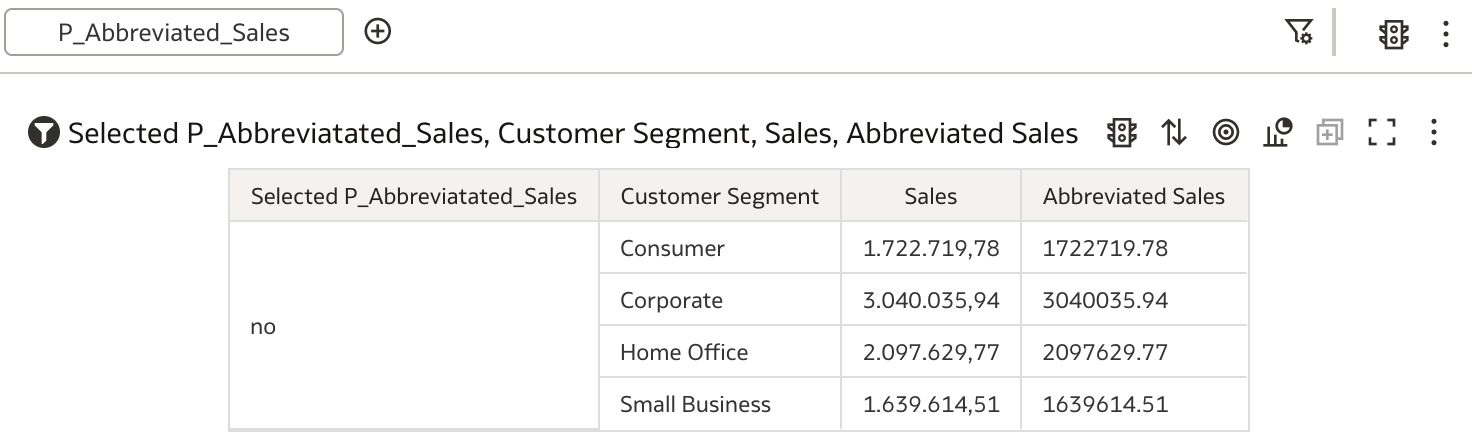
When creating a new data visualisation, previously created parameter's values have to be selectable, hence it needs to be put in Filters tab, where user can select one of the values 'no', 'K' or 'M' ...
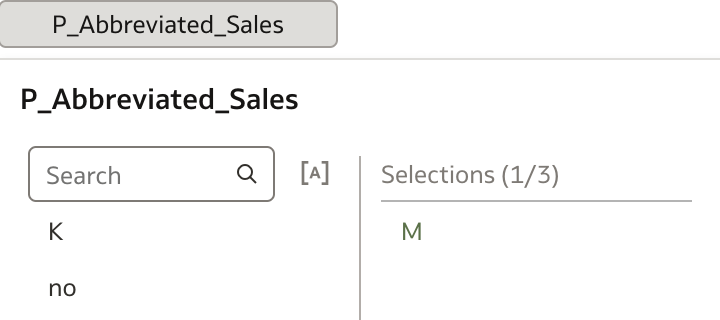
... and table is updated with the selected choice.
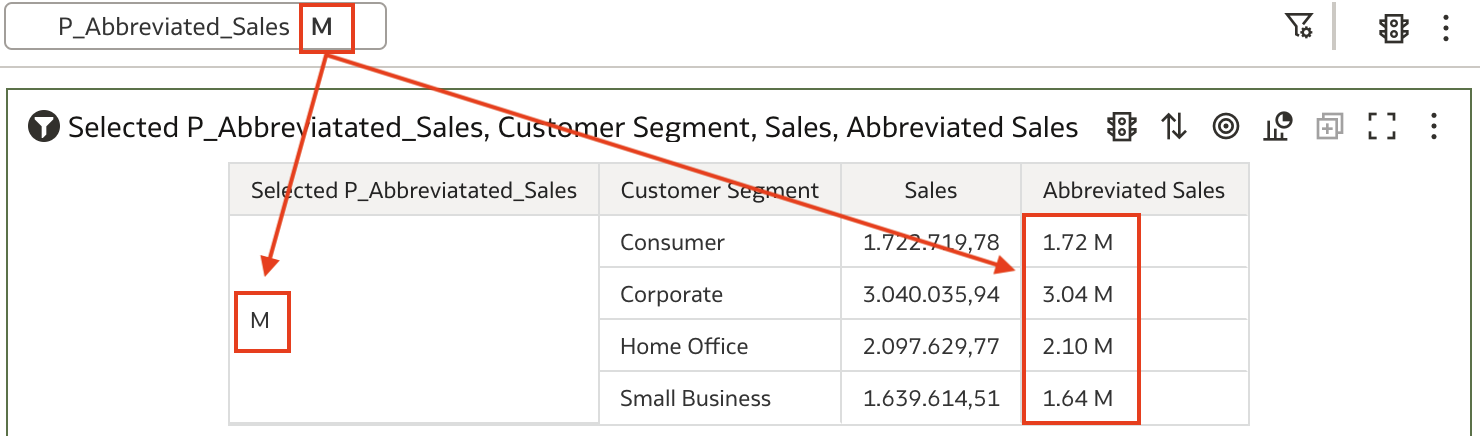
This concludes the first, very simple, example of how parameters could be used.
Example #2: Using parameters in COLUMN FILTERS
Another example of using parameters is with column filters.
For example, let's say that we need to present a sales table by product groups, but we are interested only in profit by specific customer segments. And we would like to calculate what is the share of that profit in total profit.
Again, we need to:
- create parameter which will be used for selection (in Filter tab) and
- calculation that would contain, column filter formula.
Additionally, one more calculation is needed to calculate profit % of total profit for selected customer segments.
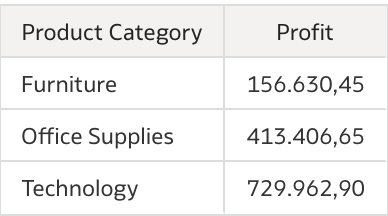
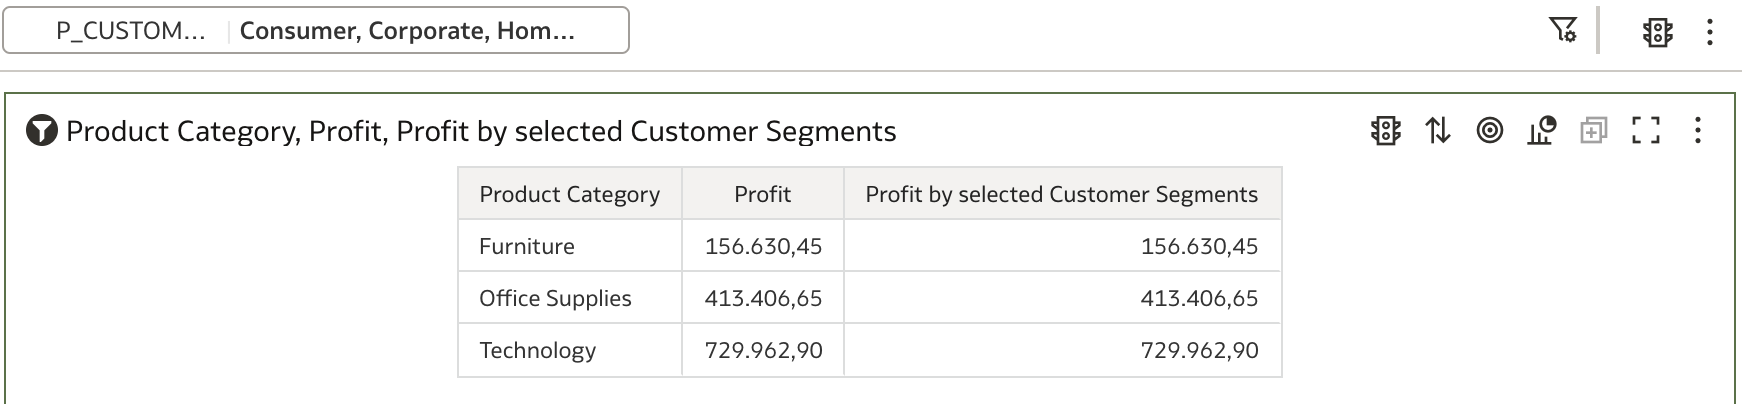
Initial table shows Profit by Product Category.
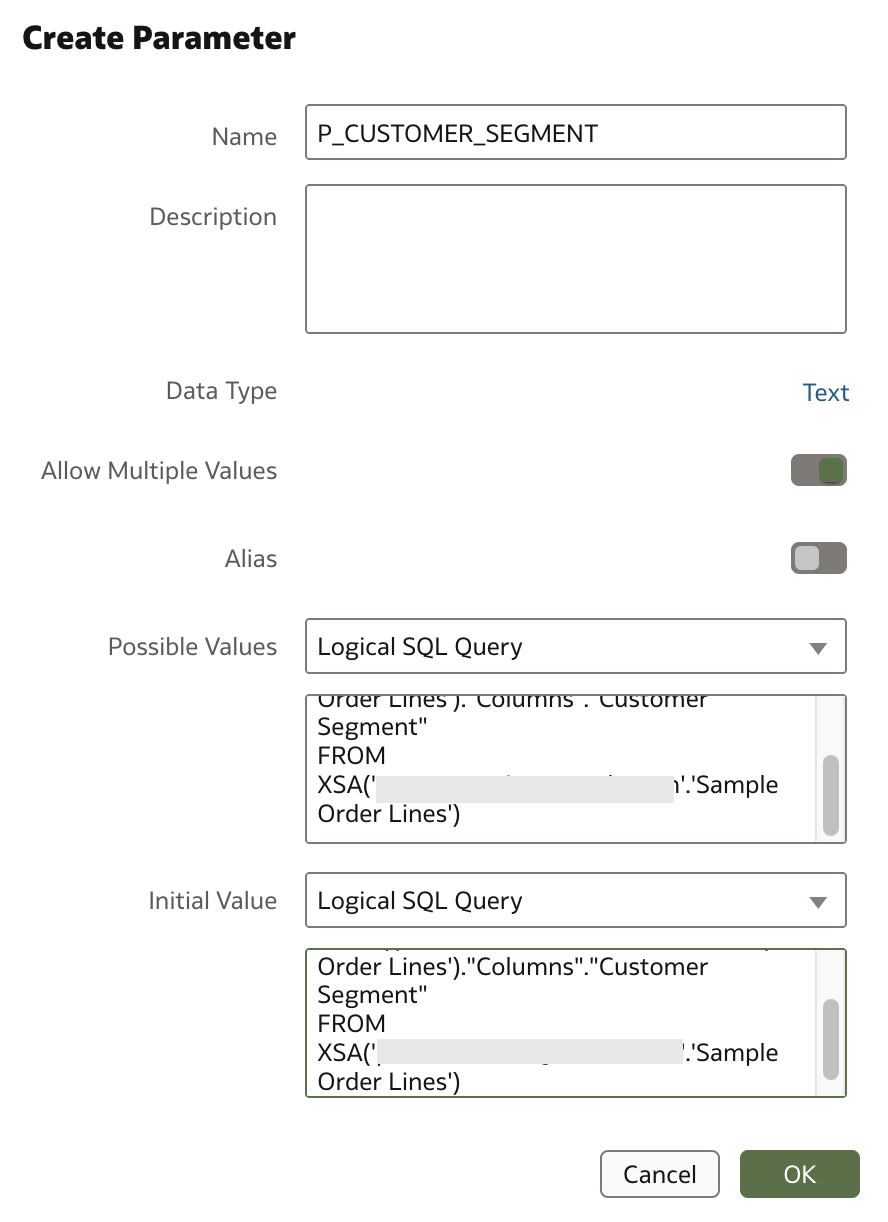
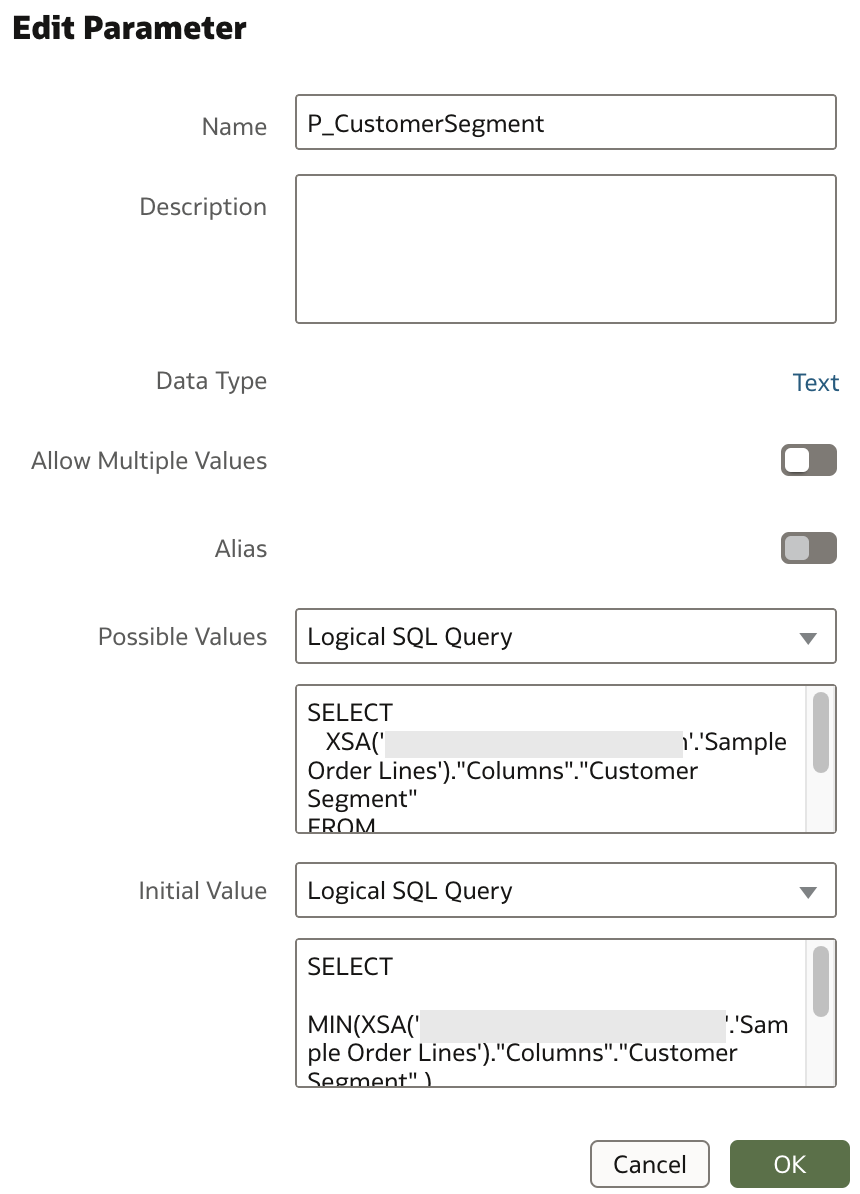
Now, we need parameter that will be used for column filtering. This parameter is based on the list of values that is populated by using a logical SQL query. This query can be easily obtained if you run a query (in a separate tab page) that displays all values for Customer Segment column. If you switch to the Developer mode, logical SQL query can be found under Logical SQL tab.
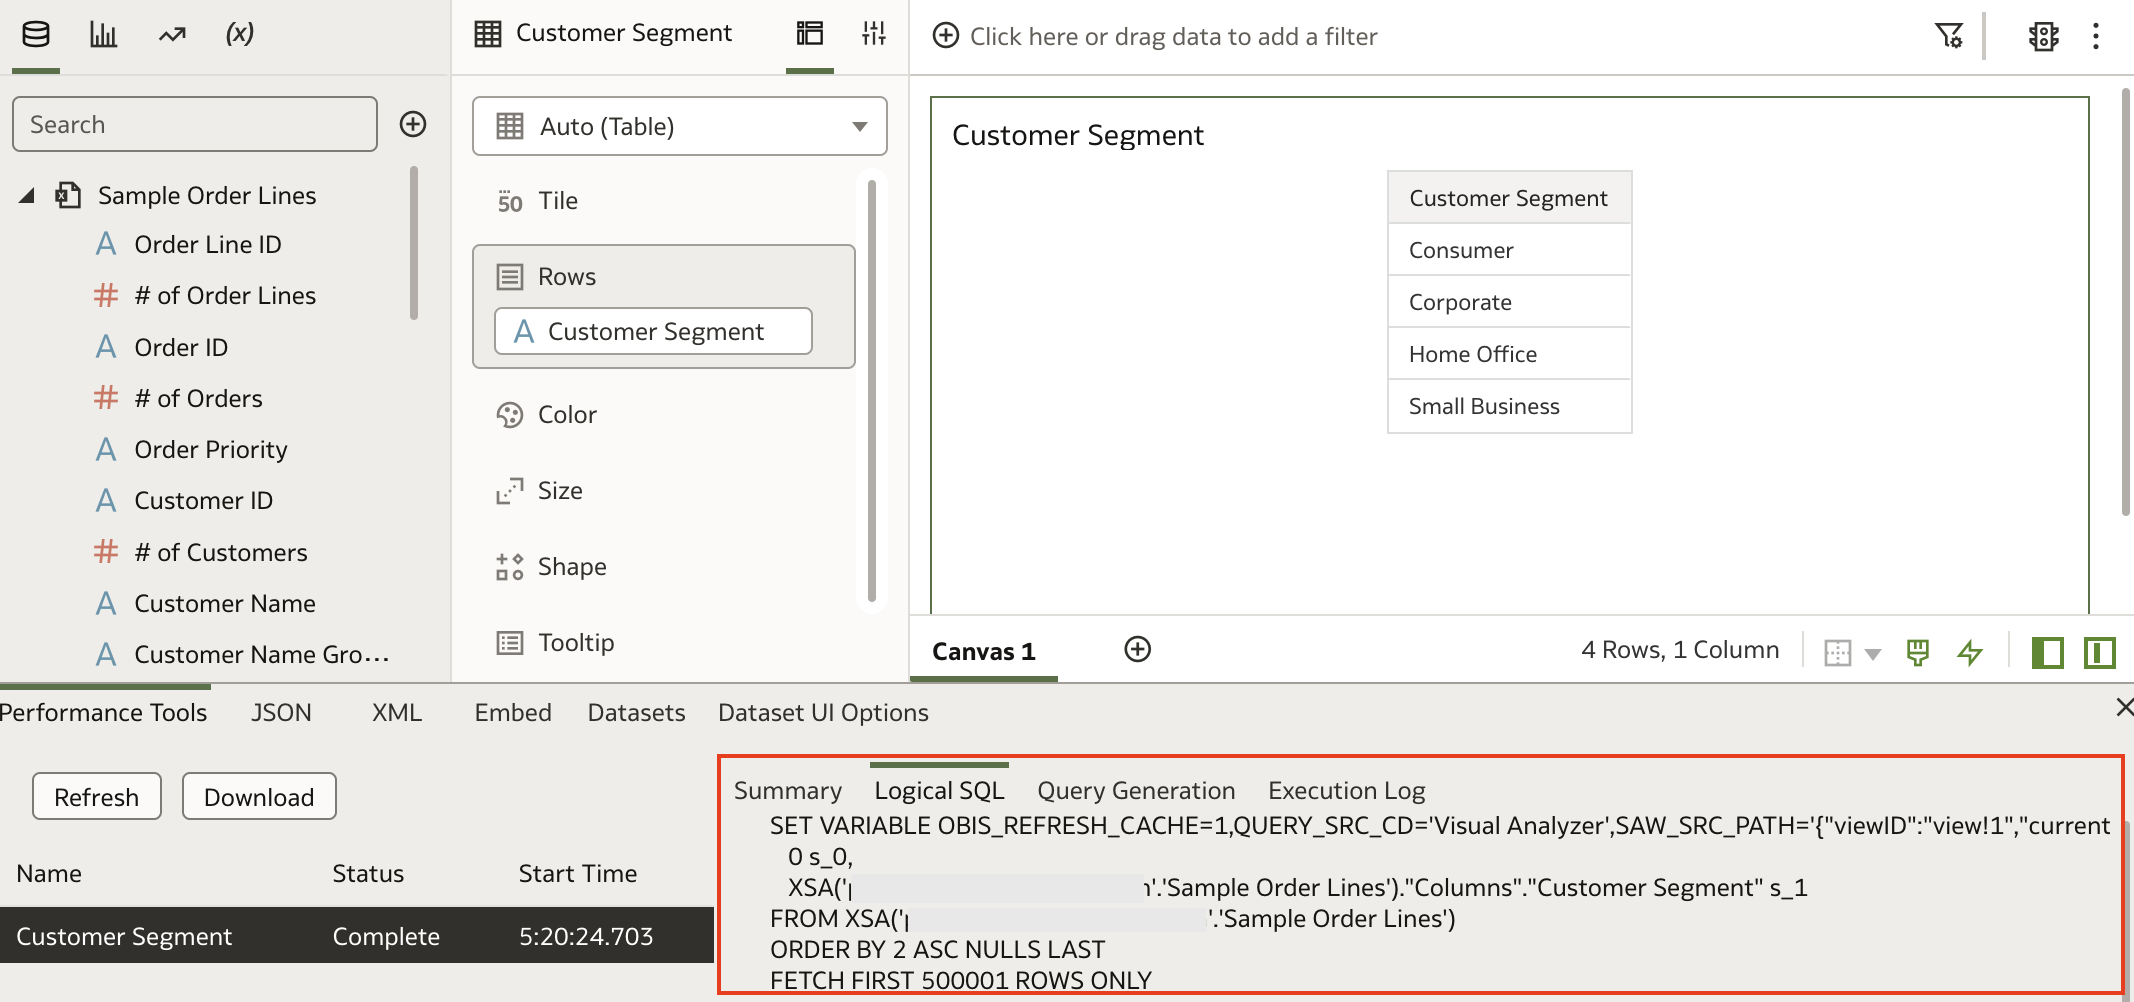
Logical SQL query needs to be copied into parameter definition. In this example, Initial Value can also be obtained by using same Logical SQL query.
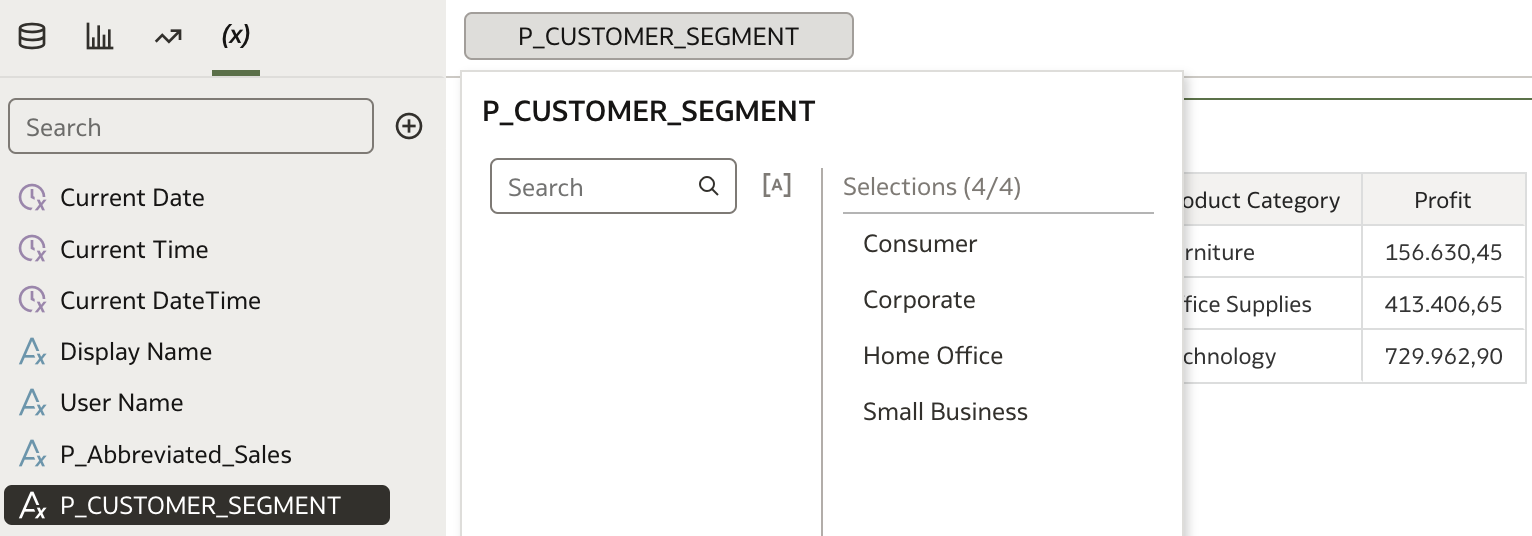
A new parameter is copied into Filters tab, where selections can be made.
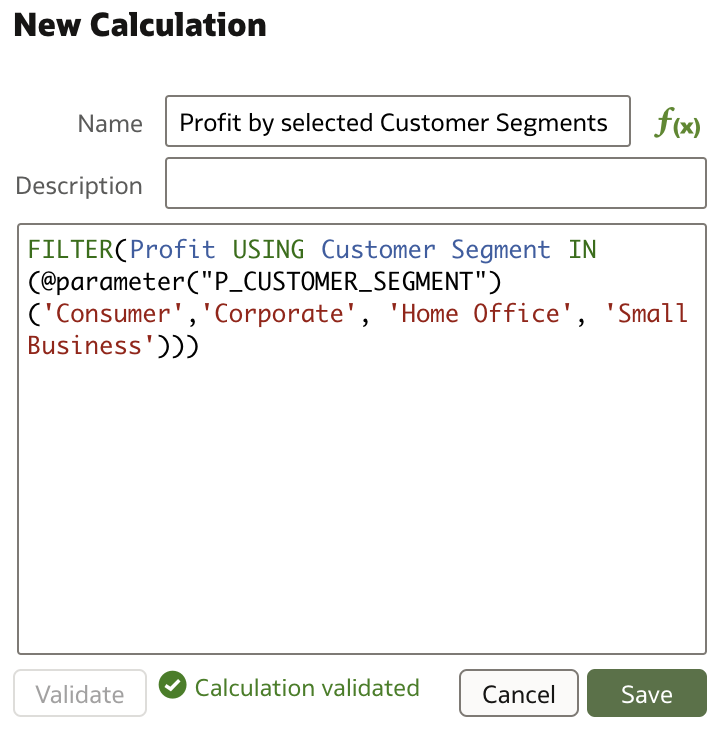
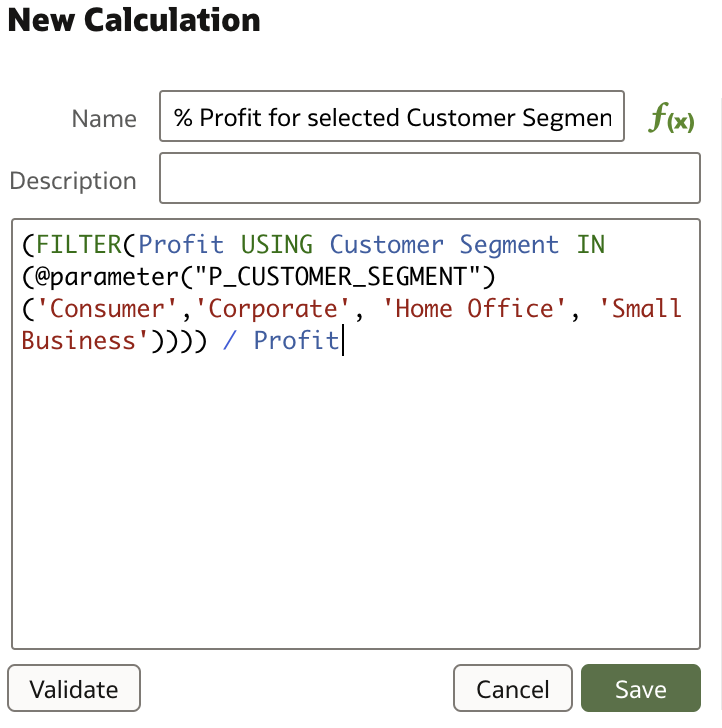
To be able to use newly created parameter, a new calculation is created. When creating a calculation, you don't need to use the required notation (@parameter ...). It is enough if you start typing the parameter name, and parameter notation will be automatically populated for you. Initial value will be required - if you don't provide it, error will be raised.
And finally, test the results. In the first example, all values (default) are selected ...
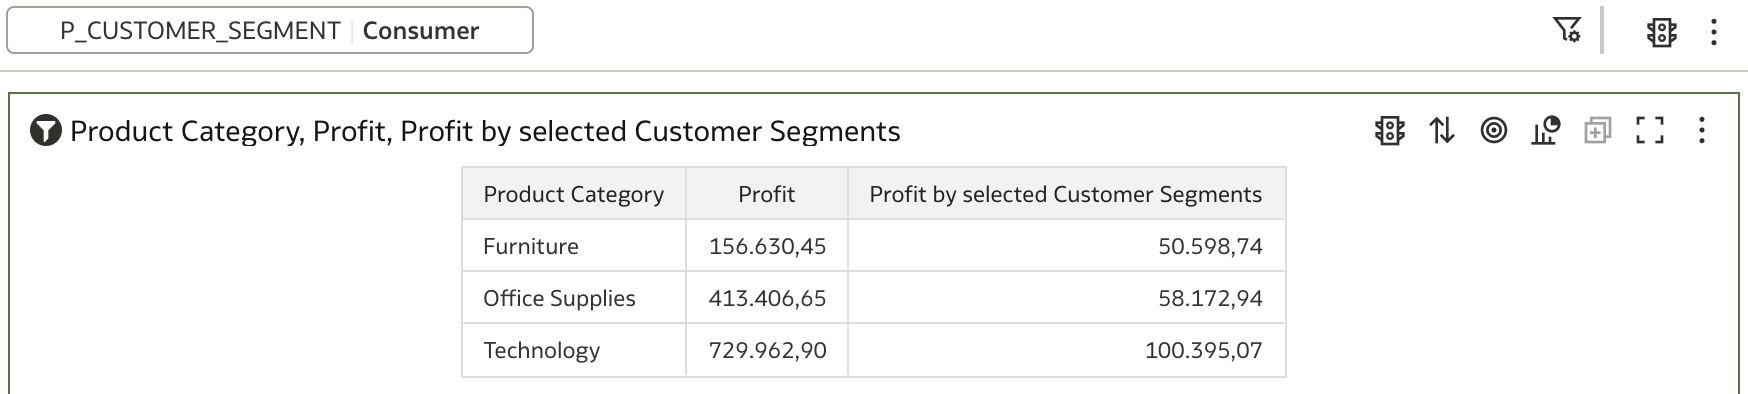
... and in the second example, only one customer segment is selected.
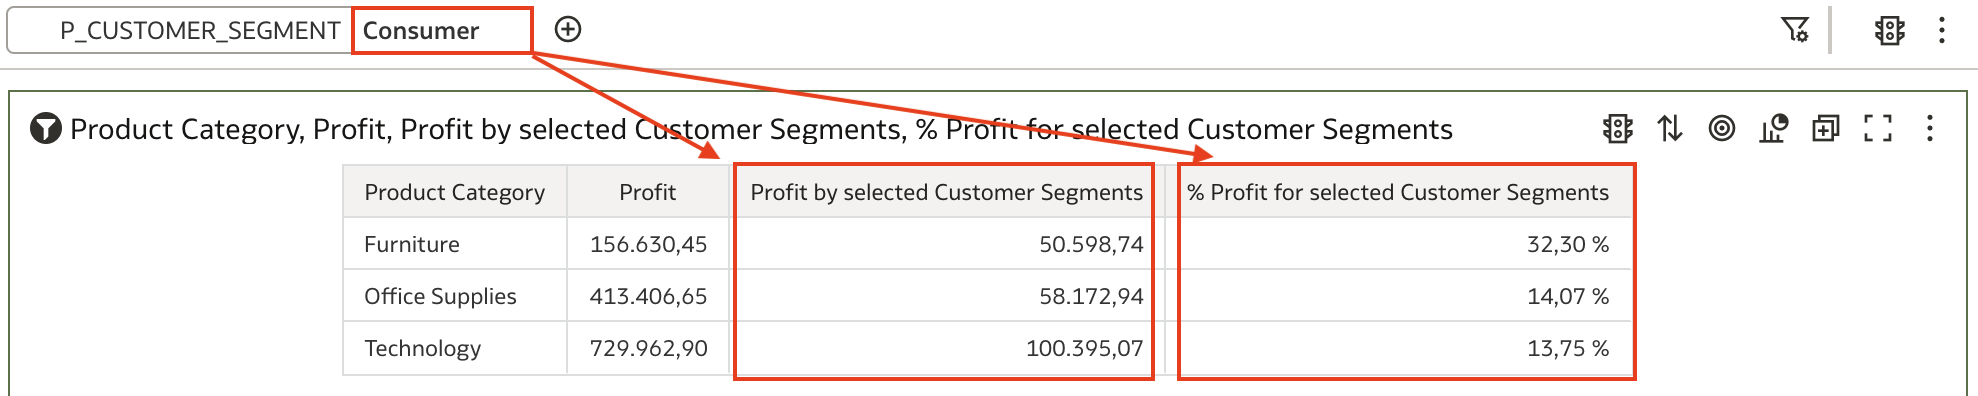
Now, we can play further. Measure that uses parameter value, can be used in another calculated measure. For example, to calculate % profit of selected Product Categories in the total profit. In this case a new calculation is created ...
... and then added (with a bit of formatting) to the existing table.
Example #3: Using parameters in Expression Filters and passing values using Data Actions
Let's investigate how to use parameters in Oracle Analytics in Expression Filters and how to pass selected parameters values to other analyses using Data Actions.
But before going into details, let's take a look at the following example. Shipping Costs Analysis by Customer Segment begins with initial analysis.
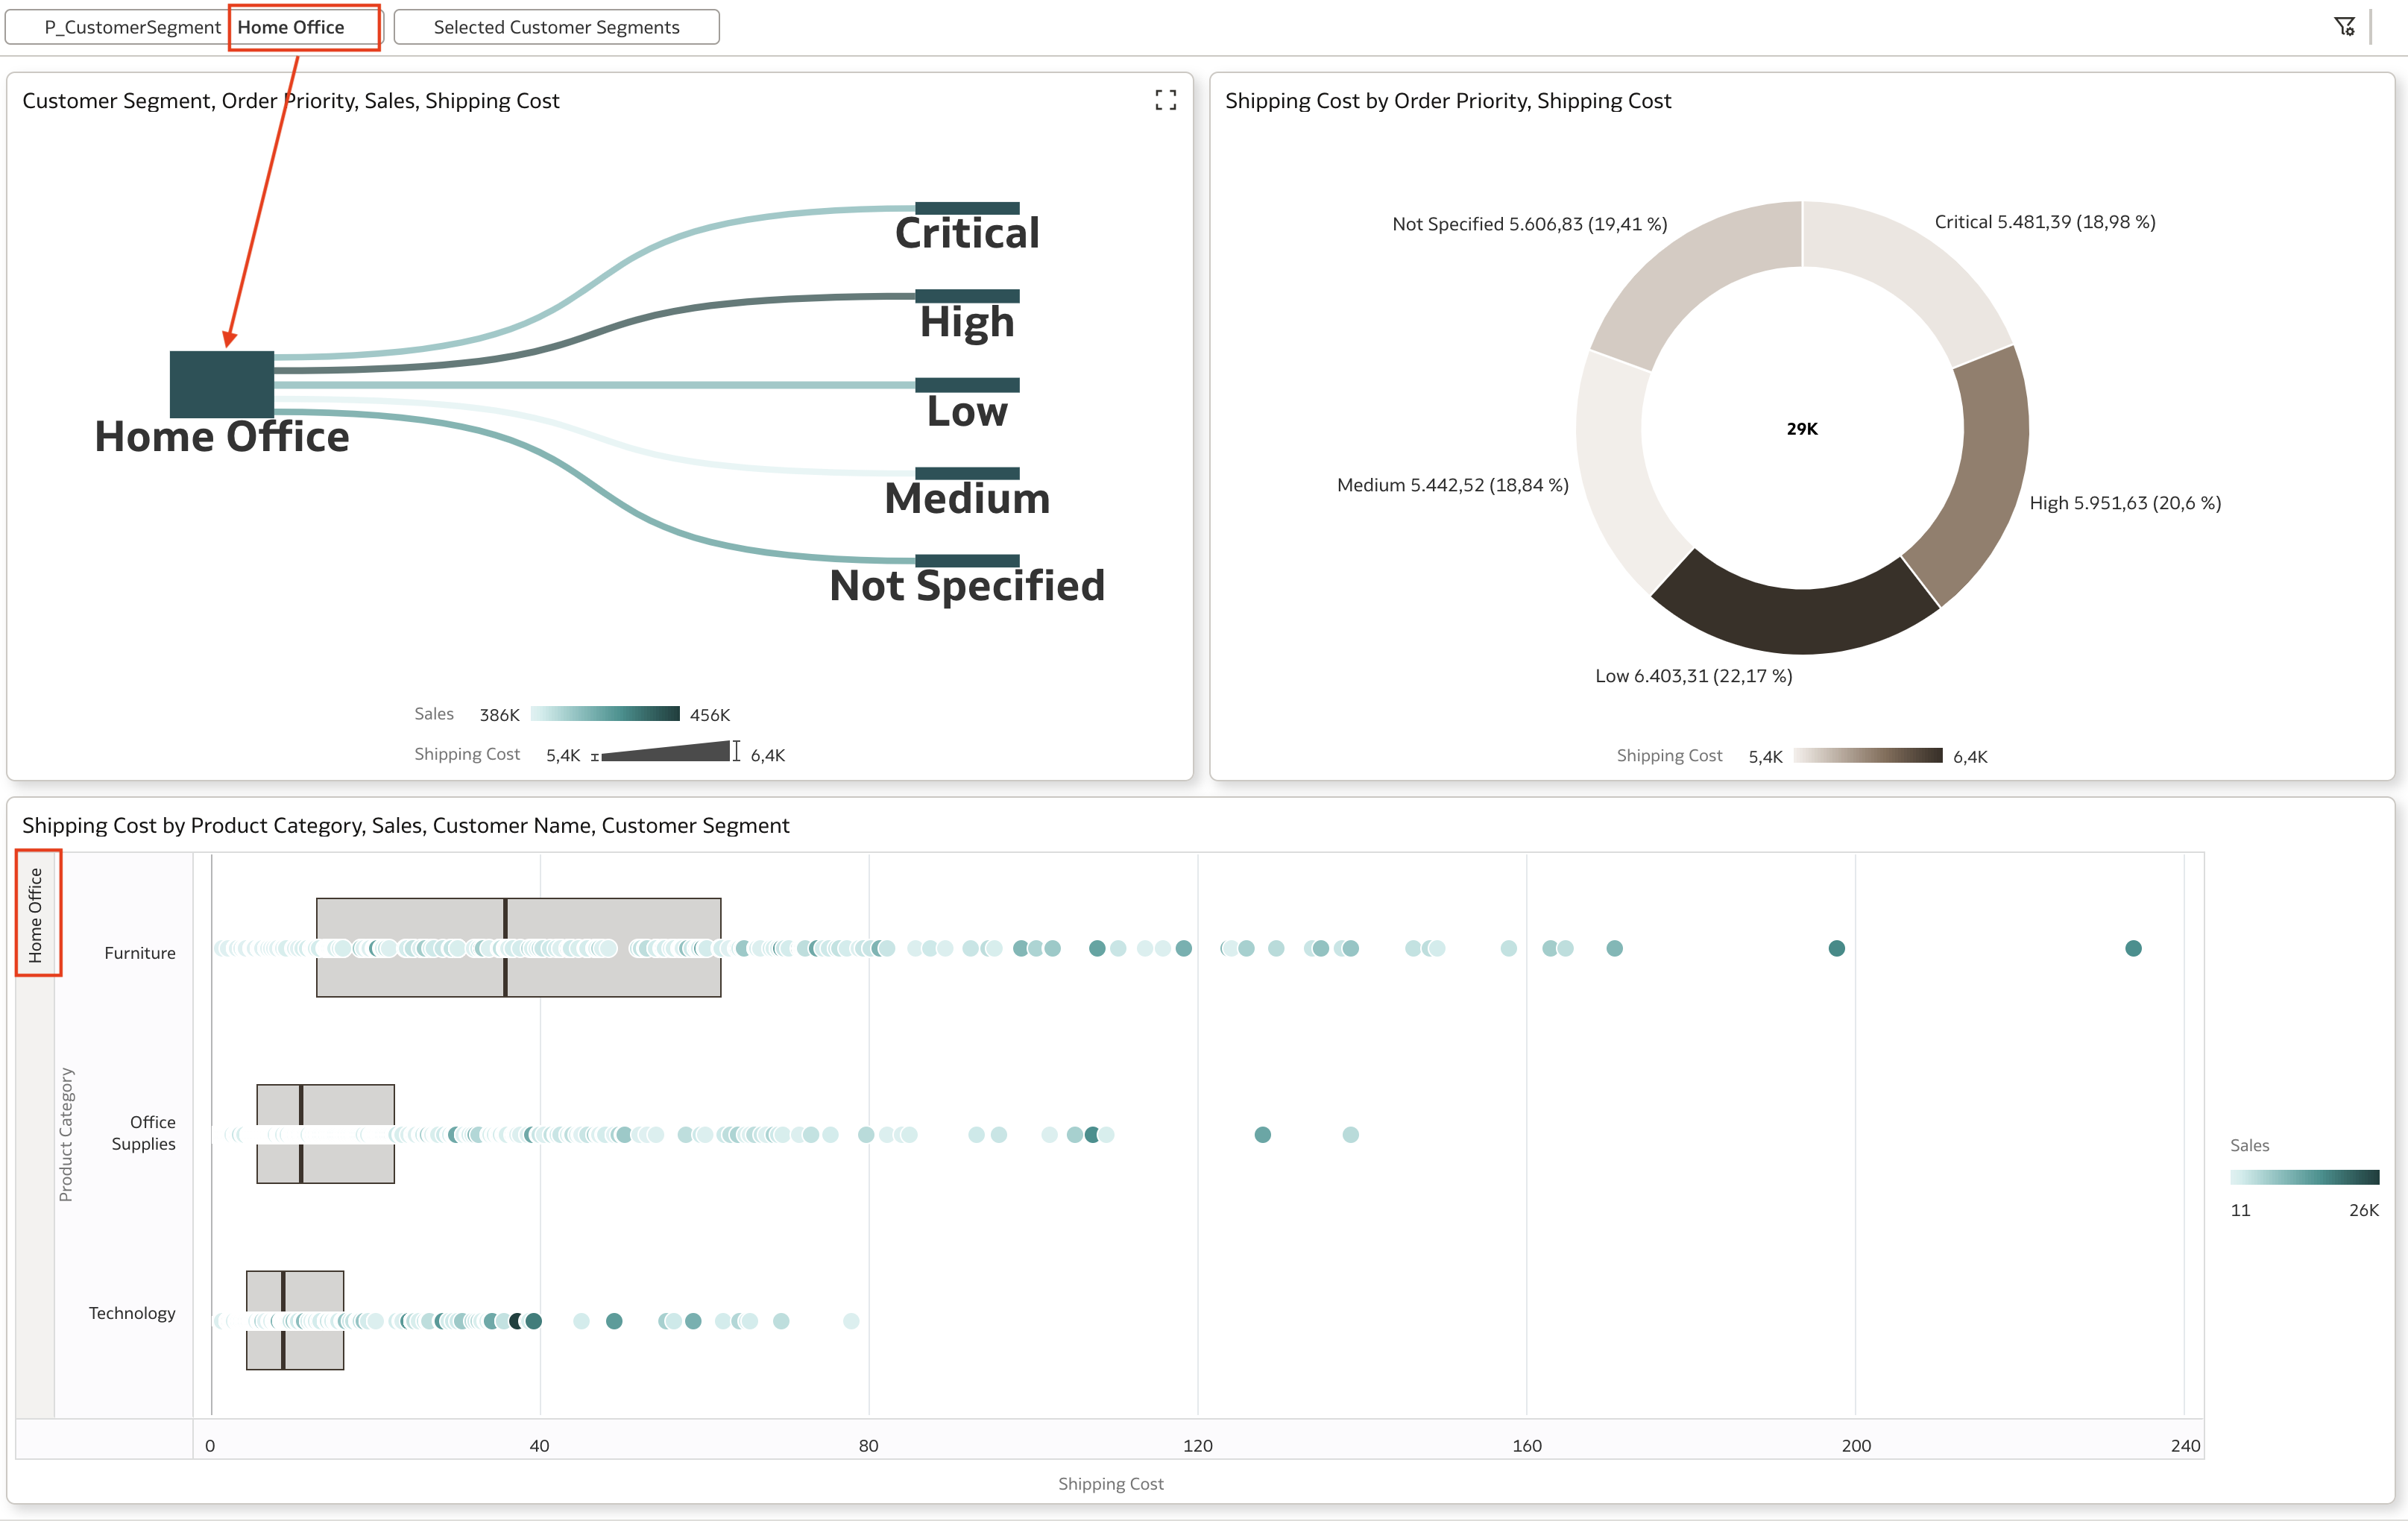
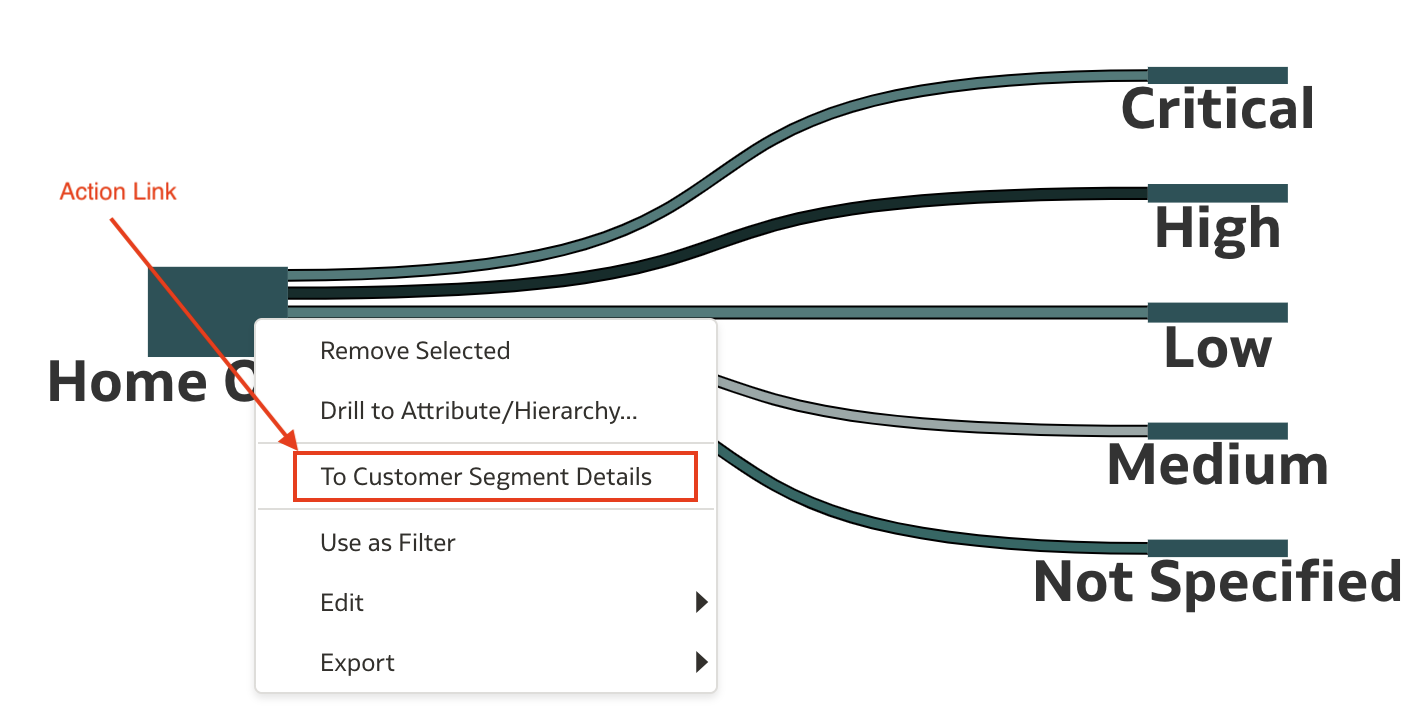
Filter on parameter P_CustomerSegment has selected value Home Office. More about filters used in this analysis a little bit later. We can see all visualization in the canvas are filtered on selected value. Right-mouse click on any visualizations open a menu where Action Link To Customer Segment Details can be selected.
This opens the 2nd workbook with additional details about shipping cost by customer segment. We can now see that selected customer segment parameter from the initial workbook has been passed to the 2nd workbook as parameter where it is applied to filter data.
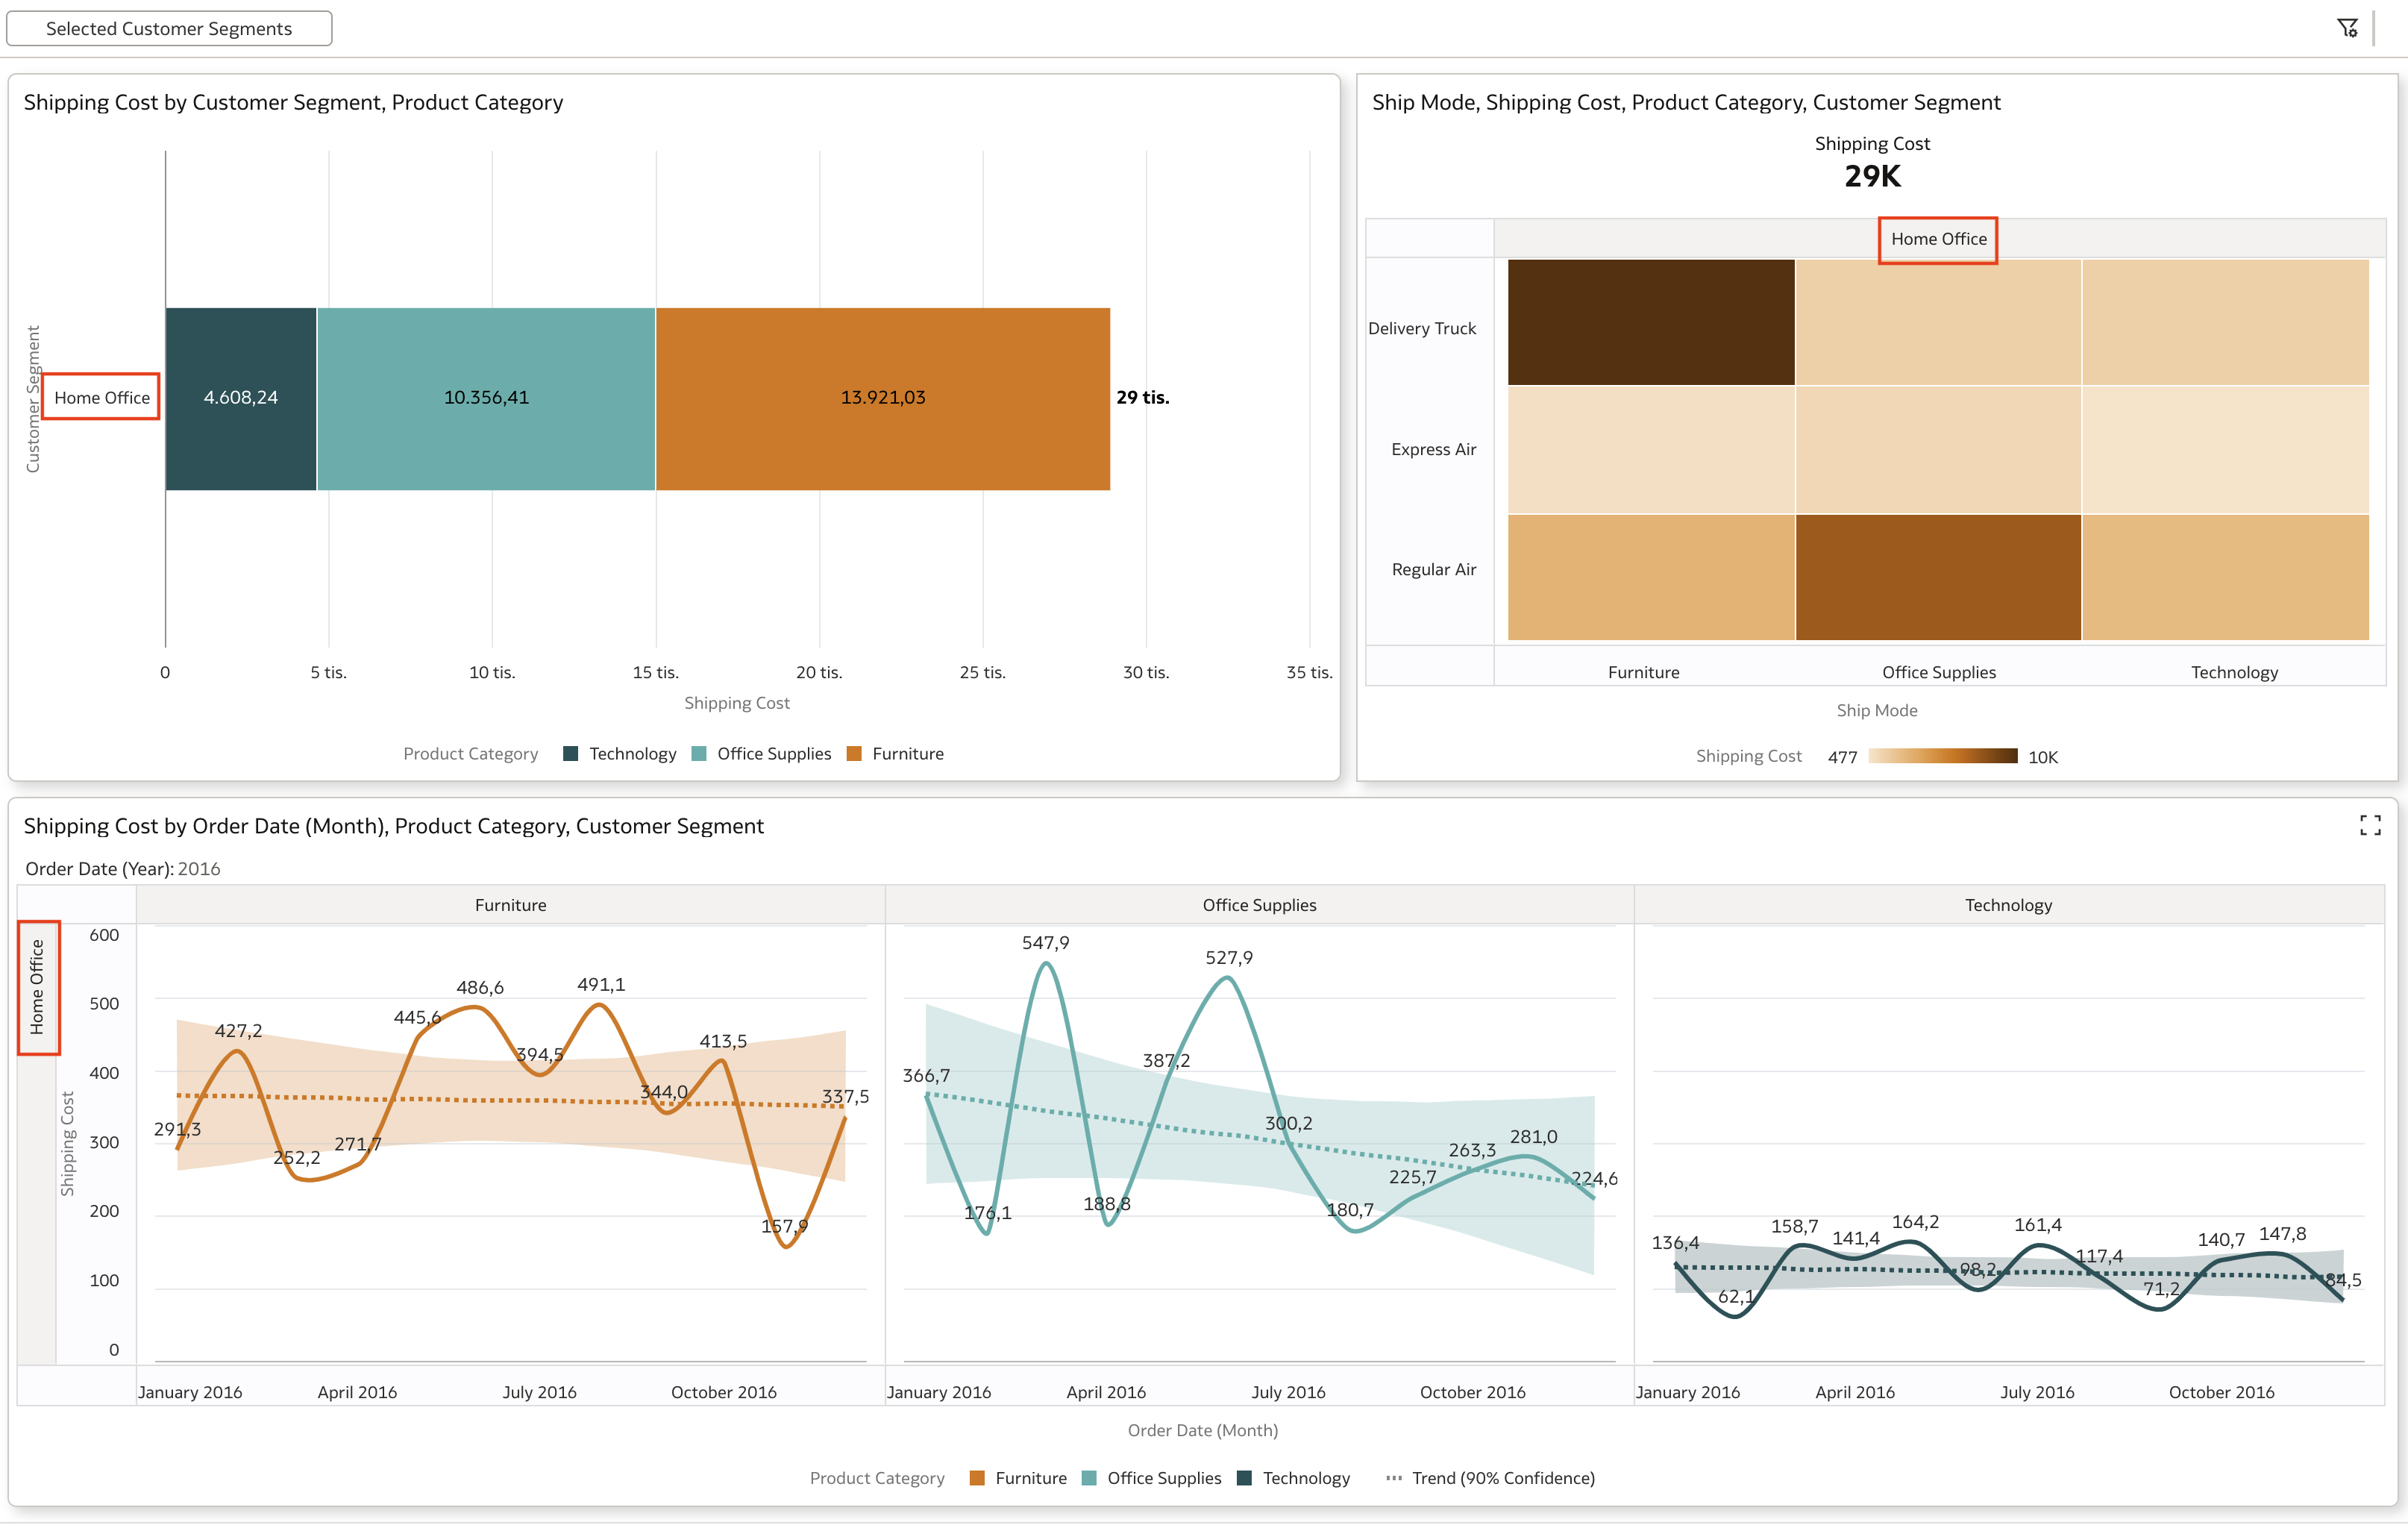
I am aware, that for this example, parameters might not be required, however it shows how parameters can be used to pass values between workbooks.
So what is required?
In the first, initial workbook, we have created:
-
Parameter with the customer segments list of values (retrieved by using logical SQL query). This parameter is used in Filter bar.
-
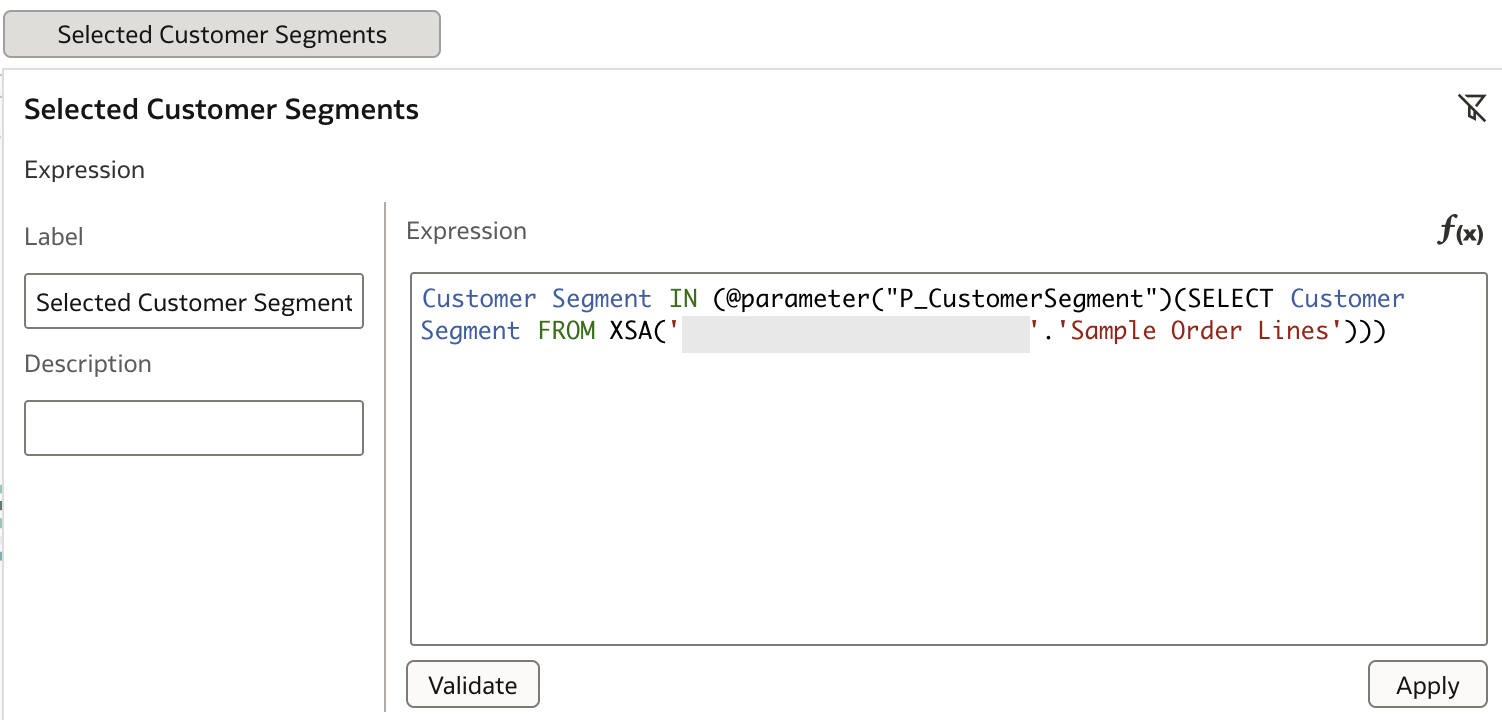
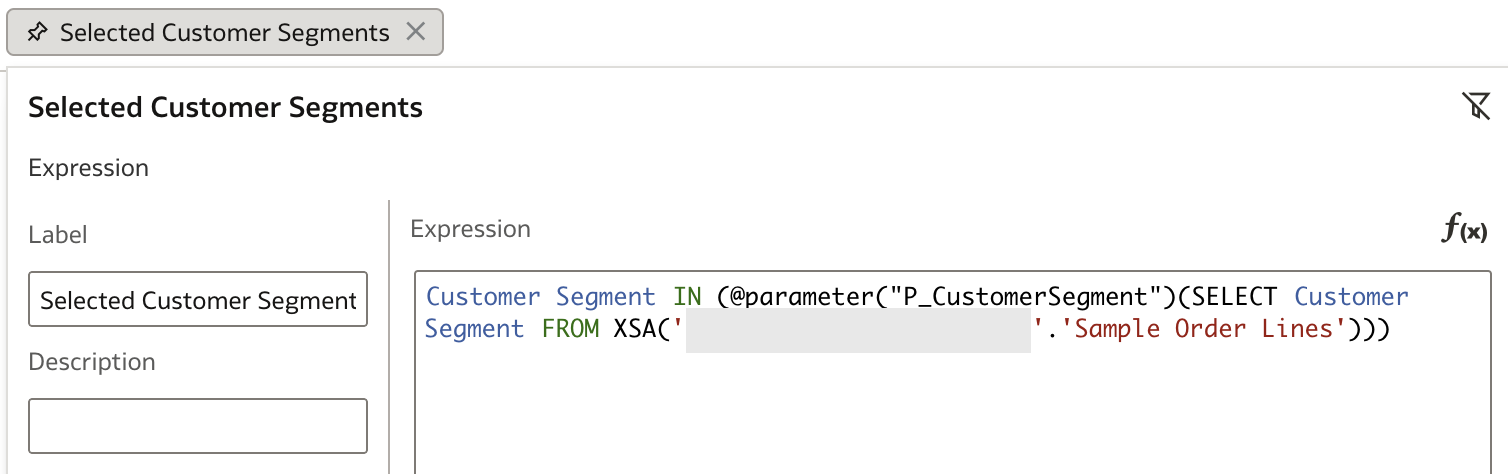
Expression filter is added to filter all visualizations in the canvas using selected parameter.
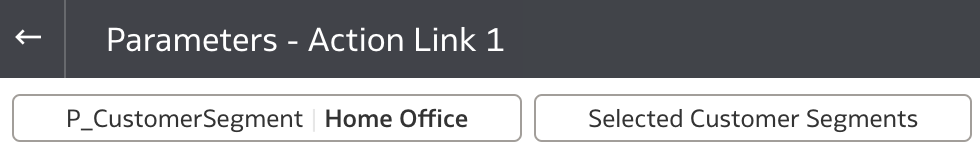
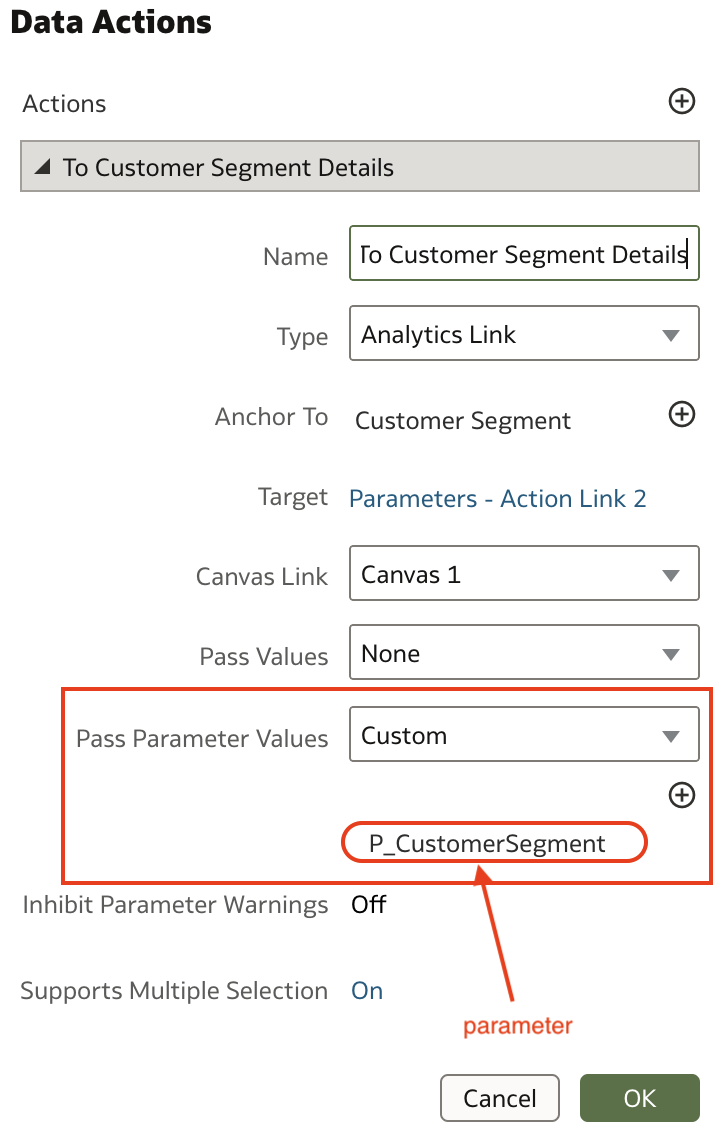
There is also a requirement to create a new Action Link which will open the 2nd workbook and pass to it selected parameter value.
You can see that there is an additional placeholder for specifying parameters to pass.
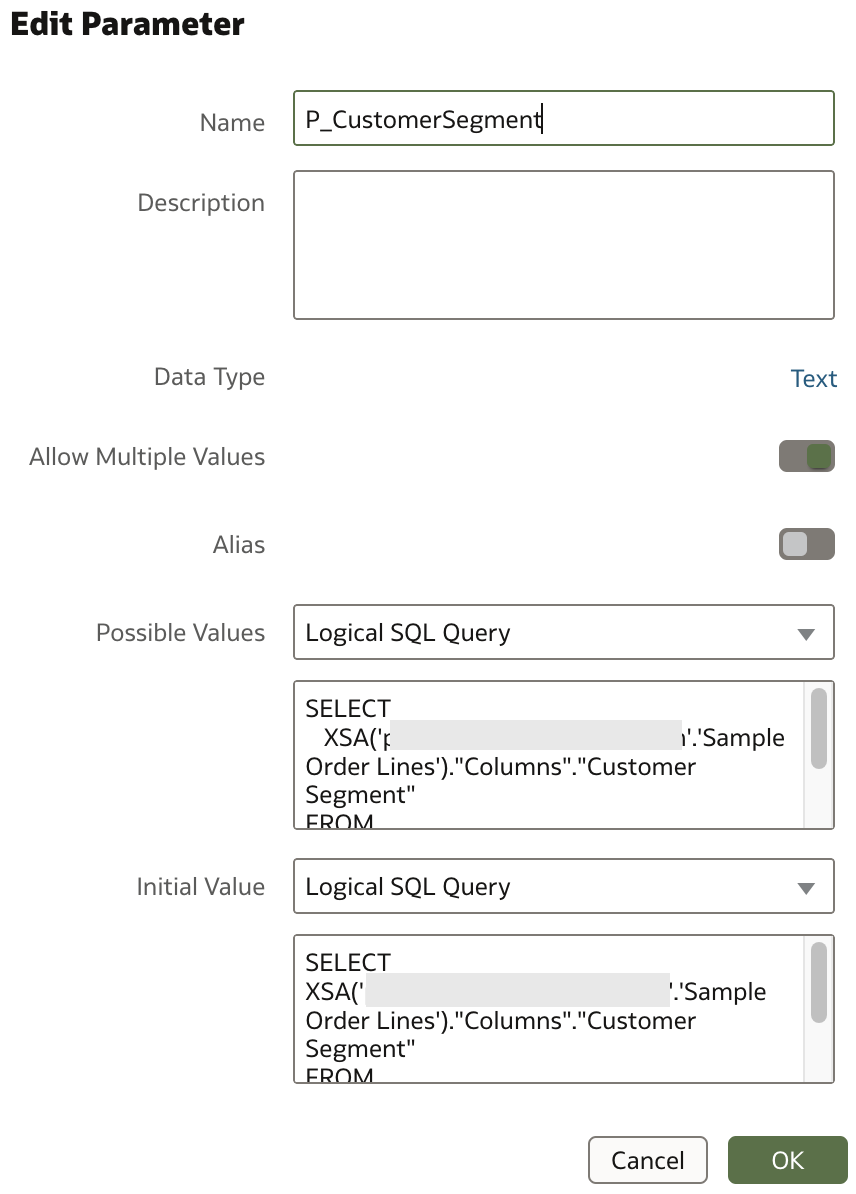
In the second workbook, a new parameter has to be created (I created identical parameter as I did in the 1st workbook):
There is also another expression filter created in order to capture passed parameter and filter data based on it. Actually, this filter's definition is also like the one we used in the first workbook:
Conclusion
Variables were always extremely important in the "old" OBIEE world. It provided developers with a lot of control and flexibility to design and build really robust and custom BI applications for their customers.
Absence of similar functionality in Data Visualization has not been observed by most of end-users and analysts, but it was definitely very missed by "traditional" BI developers.
Now this functionality is finally becoming available in Data Visualisation. With some smaller improvements I am convinced that most of "traditional" BI developers will lose one of the main arguments why they haven't started developing analytical applications using Data Visualisation. Massively.