
Oracle Analytics 6.3 is bringing updated Developer Reference feature that is now directly accessible when creating an analysis in a workbook.
Developer Reference has already been available before with JSON or XML generated code of visualization objects, code snippets for embedding visualizations in other portals, and other.
With built-in Performance Tools can be now used to analyze statistics such as query time, server time, and streaming time for visualization components in workbooks. Users can now review the logical and physical queries and check the execution log.
In order to access Performance Tools under Developer option from the Menu (top right corner).

Developer option has been, as I said, known from before, but now it includes the Performance Tools section which provides developer quite useful information about visualisation execution performance.
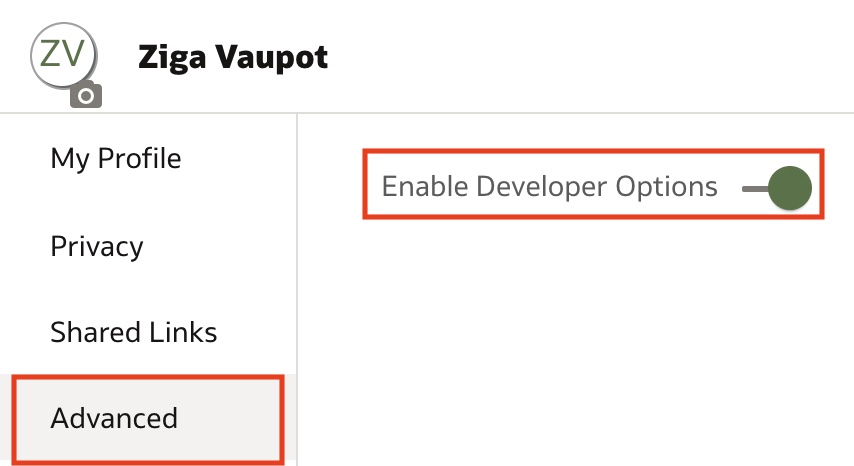
But be aware, Developer option in the Menu is not enabled by default. It has to be enabled. This can be done by navigating into user profile.

Enabling Developer Options can be found under Advanced tab in user profile.

You can now analyse statistics such as query time, server time and streaming time for all visualisation components in workbook.