
Charlie Berger and Abi Giles-Haigh ran the hands-on lab session yesterday (11th May 2021) at Analytics and Data Oracle User Community's, AnDOUC (https://analyticsanddatasummit.org/), TechCast Days, Spring Sessions with the title A Two-Step process for Detecting Fraud. I was invited to help with the HOLs alongside with Tim Vlamis and Edelweiss Kammermann.
The hands-on lab is about taking users through Oracle Machine Learning (SQL) Notebooks while using multiple use case scenarios for analysing insurance claims data and customer behavior data. Students were running the notebooks themselves to build and apply OML models inside Oracle Autonomous Database and then worked with Oracle APEX applications that leveraged OML’s insights and predictions ...
So basically, what we did was: we took the Insurance Claims data set and ran 1-Class SVM algorithm, which is used for anomaly detection in order to identify suspicious claims.
For business (and any other) users we have an option to do the whole process from Oracle Analytics directly. In this case all complexity of machine learning models are hidden from the user and are literally ideal for business users.
Oracle Analytics supports Dynamic Anomaly Detection. In order to use this nice feature, we need to create the following data flow:

In the first step we simply read CLAIMS0 database table.

Then the magic happens in the second step, Database Analytics step. This step is chosen from the following list of Database Analytics operations:

The list of the parameters that we need to provide to the algorithm is relatively short. The only mandatory parameter is actually Partition Column 1, which defines how initial dataset splits into distinct data slices.
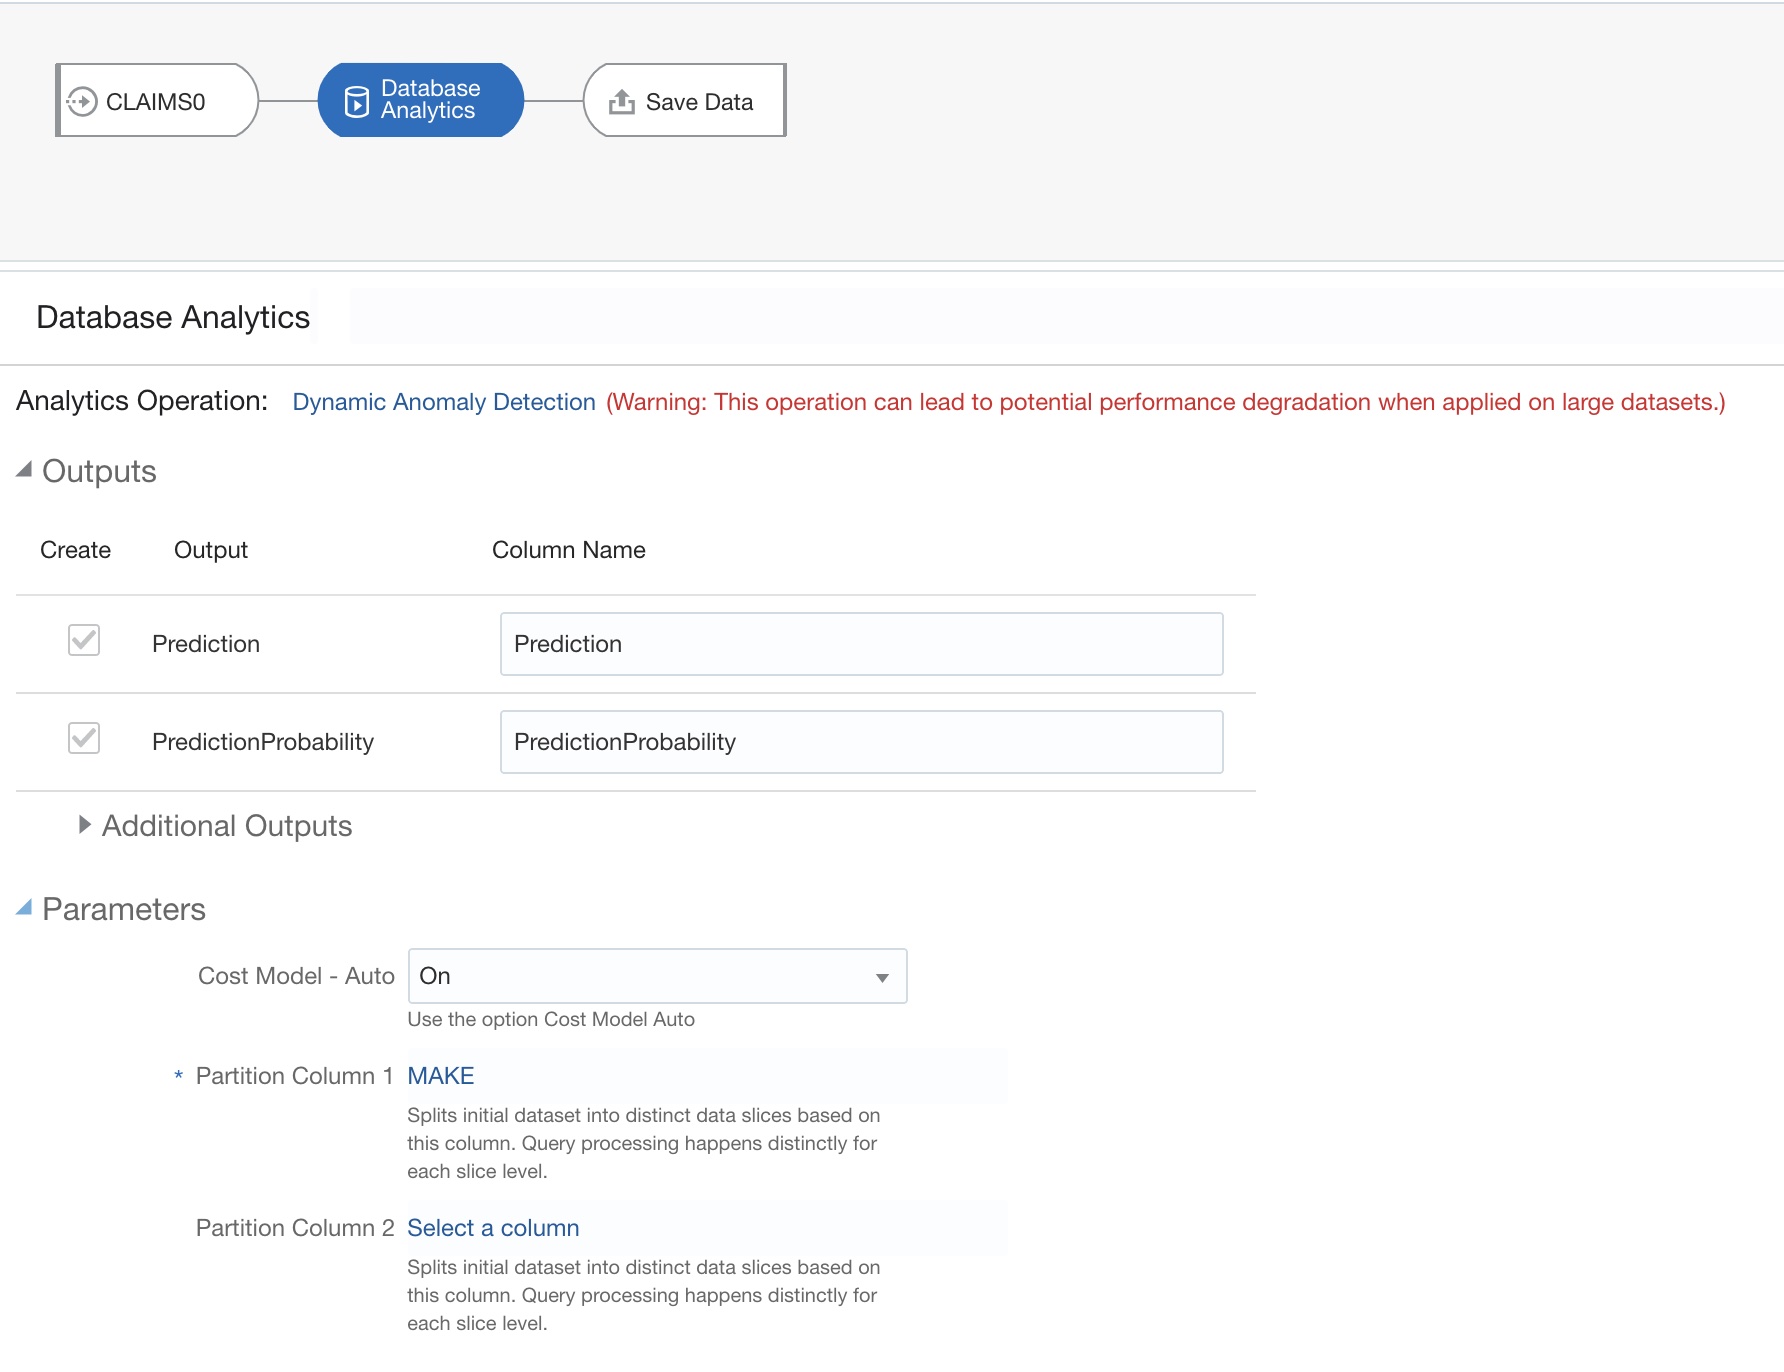
Actually, the list of Outputs can be longer. Beside Prediction which tells us if claim is fraudulent or not and Prediction Probability, algorithm can return several attributes which explains the prediction and exposes key attributes important for the prediction.

And finally, in the last step we can save results of the prediction as a new data set.

We can now check newly created data set Suspicious Dataset in Data Visualisation Project, for example:
