Probably, the most important feature in Oracle Analytics January 2022 Update (v6.4) is Auto Insights.
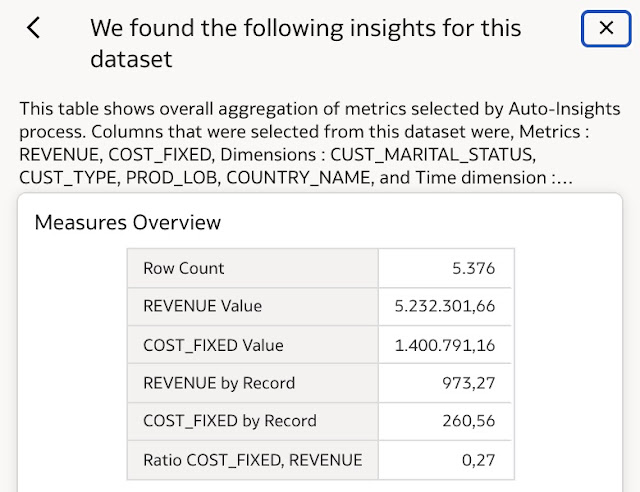
Auto Insights is a new feature where datasets are automatically analysed and data visualisations are suggested to an analyst to be included in an analysis.


Each data visualisation consist of autogenerated data visualisation and textual explanation of that visualisation.

Autogenerated text is automatically copied into Title Tooltip and is displayed on hover over the title.

Currently Auto Insights are available with most of dataset types, however there are limitations when using subject areas and multidimensional databases. These data sources (unfortunatelly) are not supported at this moment.
My friend Joel Acha, Oracle ACE, has been analysing Auto Insights already in much more detail in his blog post Auto Insights – The latest “Blank Canvas Syndrome” weapon.
There are some minor (comparing to the Auto Insights) updates and new features in the January 2022.
The very visible is the look and feel. With the latest release, Oracle Analytics fully adopts the Redwood Design:


The 3rd improvement relates to data set management. When a data set is created, then often metadata or other attributes are set. It was very time-consuming in the past to change properties for each and every column in a dataset, especially if the change was the same for several columns. Now, this can be done simply by one change, and all columns with same setting will be updated.

On the Machine Learning side, users can register and apply XBoost and Neural Networks algorithms. You were able to register these already before, but the model was like a black box to the users as details and related information (available with all other algorithms) was not shown.
Now any user can review the details of the model and evaluate the performance by reviewing the statistics and other relevant information.
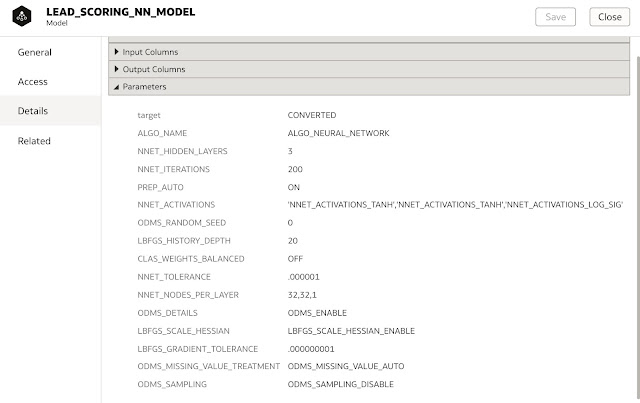
You can now evaluate the performance of the models by analysing the views that are listed in the Related tab of the model.

We will look at this new functionality in a separate blog post.